| __timestamp | EMCOR Group, Inc. | TransUnion |
|---|---|---|
| Wednesday, January 1, 2014 | 626478000 | 436000000 |
| Thursday, January 1, 2015 | 656573000 | 499700000 |
| Friday, January 1, 2016 | 725538000 | 560100000 |
| Sunday, January 1, 2017 | 757062000 | 585400000 |
| Monday, January 1, 2018 | 799157000 | 707700000 |
| Tuesday, January 1, 2019 | 893453000 | 812100000 |
| Wednesday, January 1, 2020 | 903584000 | 860300000 |
| Friday, January 1, 2021 | 970937000 | 943900000 |
| Saturday, January 1, 2022 | 1038717000 | 1337400000 |
| Sunday, January 1, 2023 | 1211233000 | 1171600000 |
| Monday, January 1, 2024 | 1239300000 |
Unleashing insights
In the ever-evolving landscape of corporate finance, understanding the trends in Selling, General, and Administrative (SG&A) expenses is crucial for investors and analysts alike. Over the past decade, EMCOR Group, Inc. and TransUnion have shown distinct trajectories in their SG&A expenditures. From 2014 to 2023, EMCOR's SG&A expenses surged by approximately 93%, reflecting a strategic expansion and increased operational costs. In contrast, TransUnion's expenses grew by about 169% during the same period, indicating a more aggressive growth strategy.
These trends highlight the dynamic nature of SG&A expenses and their impact on corporate strategies.
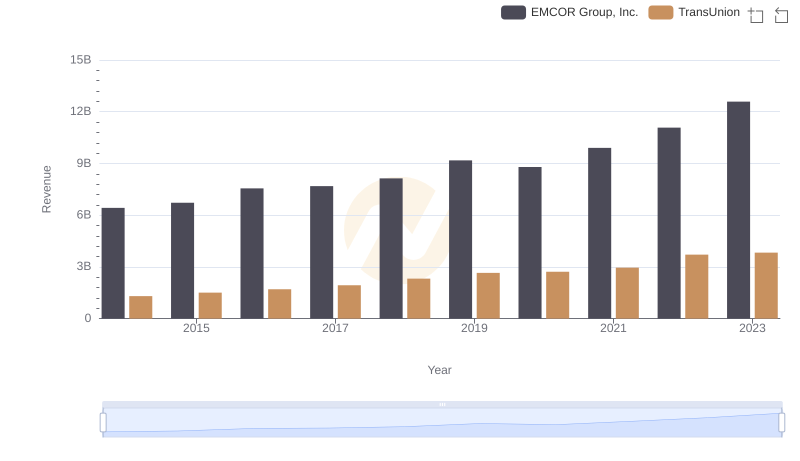
Revenue Insights: EMCOR Group, Inc. and TransUnion Performance Compared
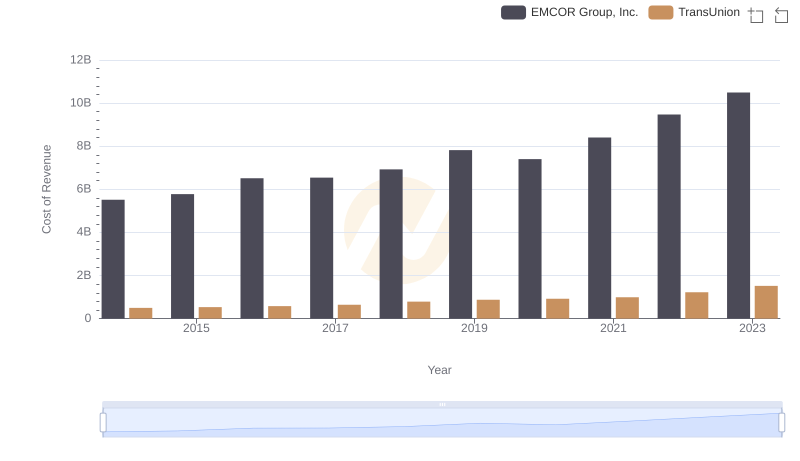
Cost of Revenue Trends: EMCOR Group, Inc. vs TransUnion
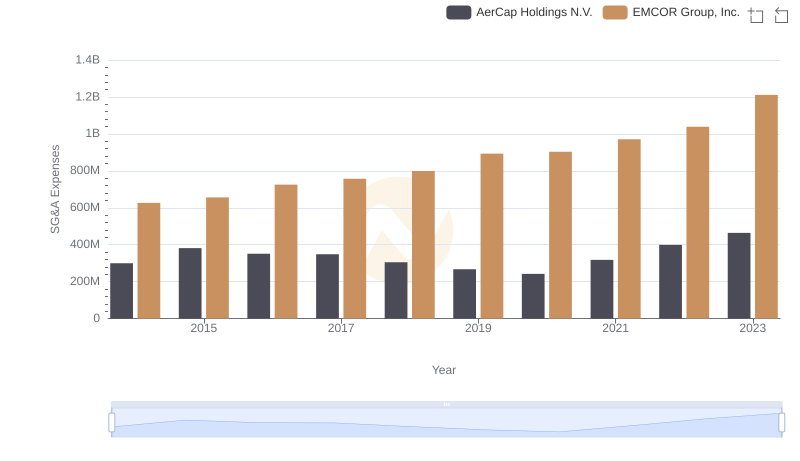
Comparing SG&A Expenses: EMCOR Group, Inc. vs AerCap Holdings N.V. Trends and Insights
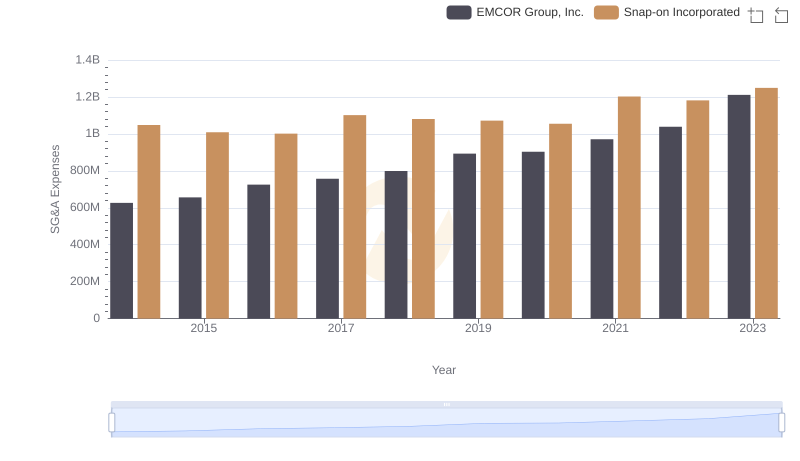
Breaking Down SG&A Expenses: EMCOR Group, Inc. vs Snap-on Incorporated
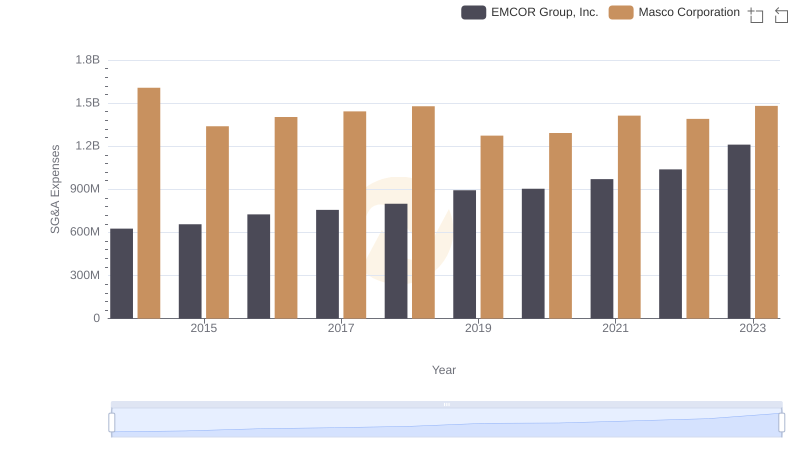
SG&A Efficiency Analysis: Comparing EMCOR Group, Inc. and Masco Corporation
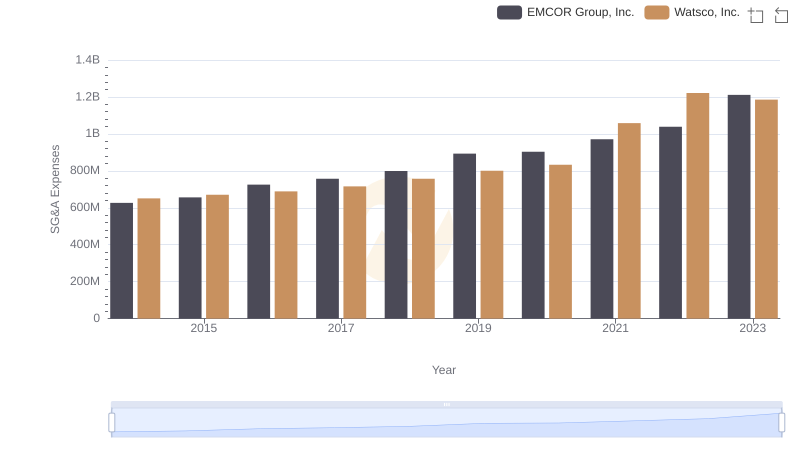
Cost Management Insights: SG&A Expenses for EMCOR Group, Inc. and Watsco, Inc.
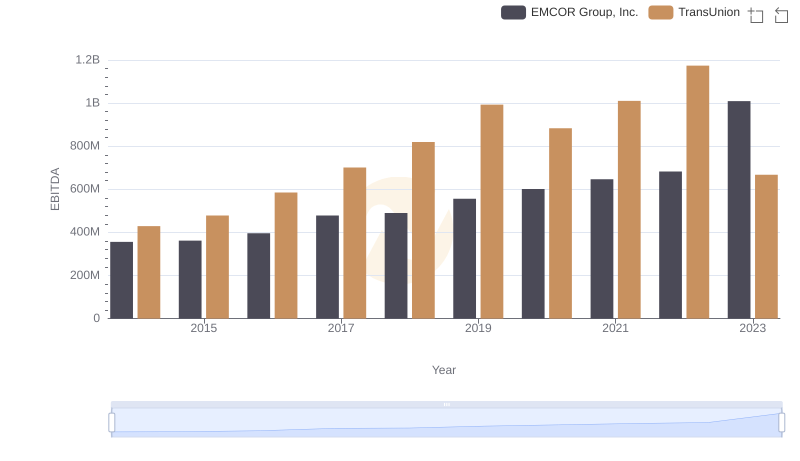
Comprehensive EBITDA Comparison: EMCOR Group, Inc. vs TransUnion

Breaking Down SG&A Expenses: EMCOR Group, Inc. vs J.B. Hunt Transport Services, Inc.
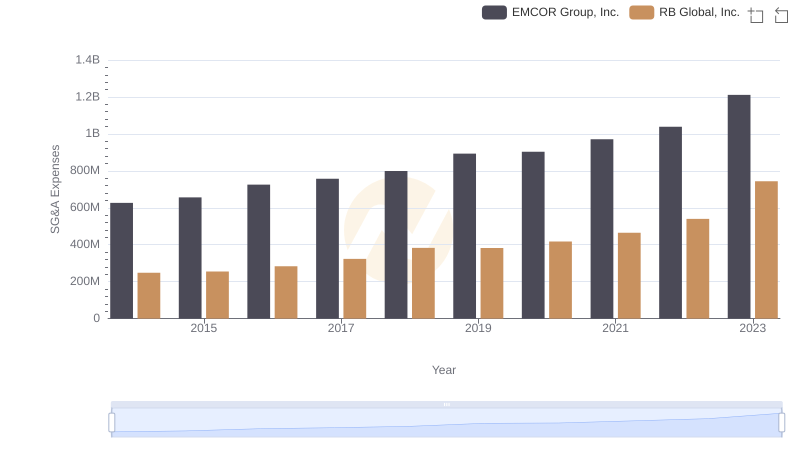
EMCOR Group, Inc. and RB Global, Inc.: SG&A Spending Patterns Compared
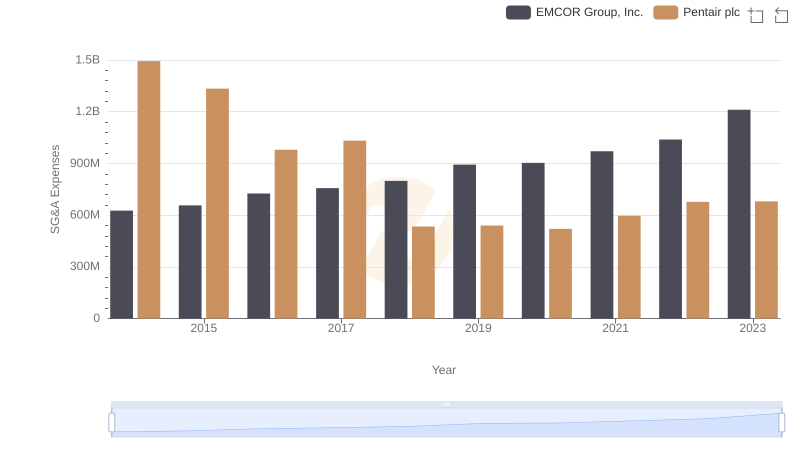
EMCOR Group, Inc. and Pentair plc: SG&A Spending Patterns Compared