| __timestamp | AerCap Holdings N.V. | EMCOR Group, Inc. |
|---|---|---|
| Wednesday, January 1, 2014 | 299900000 | 626478000 |
| Thursday, January 1, 2015 | 381308000 | 656573000 |
| Friday, January 1, 2016 | 351012000 | 725538000 |
| Sunday, January 1, 2017 | 348291000 | 757062000 |
| Monday, January 1, 2018 | 305226000 | 799157000 |
| Tuesday, January 1, 2019 | 267458000 | 893453000 |
| Wednesday, January 1, 2020 | 242161000 | 903584000 |
| Friday, January 1, 2021 | 317888000 | 970937000 |
| Saturday, January 1, 2022 | 399530000 | 1038717000 |
| Sunday, January 1, 2023 | 464128000 | 1211233000 |
Unlocking the unknown
In the world of corporate finance, Selling, General, and Administrative (SG&A) expenses are a crucial indicator of a company's operational efficiency. Over the past decade, EMCOR Group, Inc. and AerCap Holdings N.V. have shown contrasting trends in their SG&A expenses.
From 2014 to 2023, EMCOR Group, Inc. has seen a consistent rise in SG&A expenses, growing by approximately 93%. This upward trajectory reflects the company's expanding operations and strategic investments in administrative capabilities. By 2023, EMCOR's SG&A expenses reached a peak, indicating robust growth and possibly increased market share.
In contrast, AerCap Holdings N.V. experienced a more volatile pattern. After a dip in 2020, their SG&A expenses rebounded, culminating in a 55% increase by 2023. This fluctuation could be attributed to strategic shifts and market adaptations.
These trends highlight the dynamic nature of corporate financial strategies and the importance of SG&A expenses in understanding a company's operational focus.
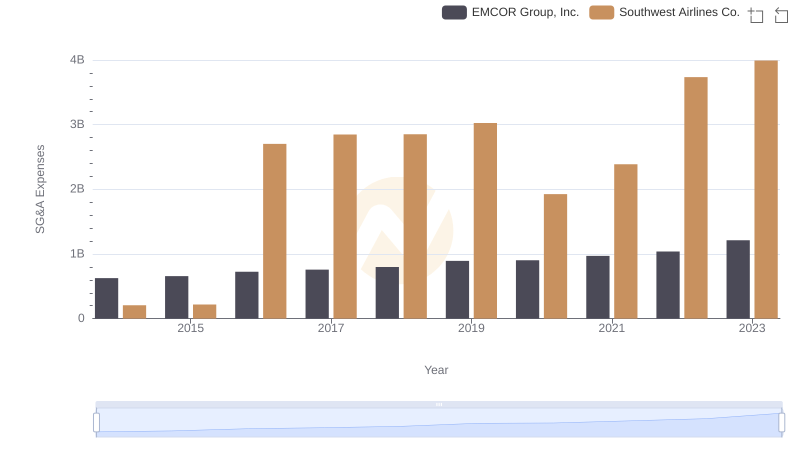
Breaking Down SG&A Expenses: EMCOR Group, Inc. vs Southwest Airlines Co.
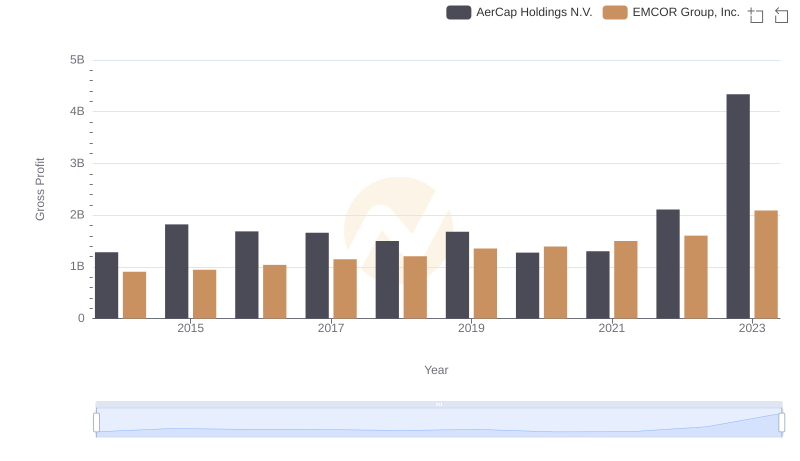
EMCOR Group, Inc. vs AerCap Holdings N.V.: A Gross Profit Performance Breakdown
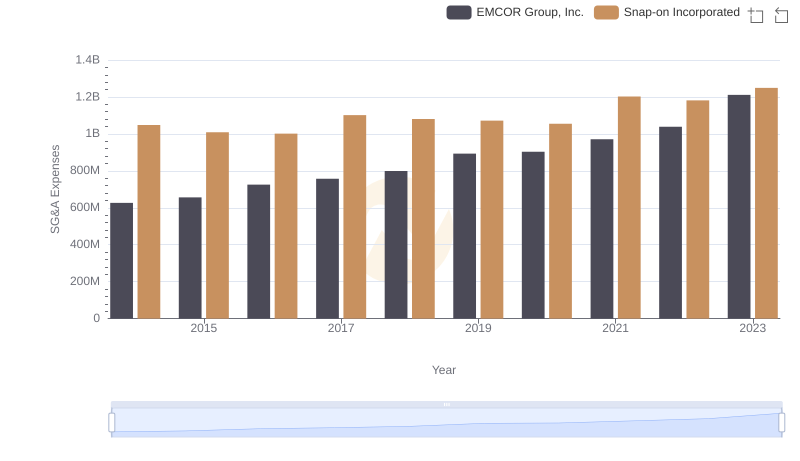
Breaking Down SG&A Expenses: EMCOR Group, Inc. vs Snap-on Incorporated
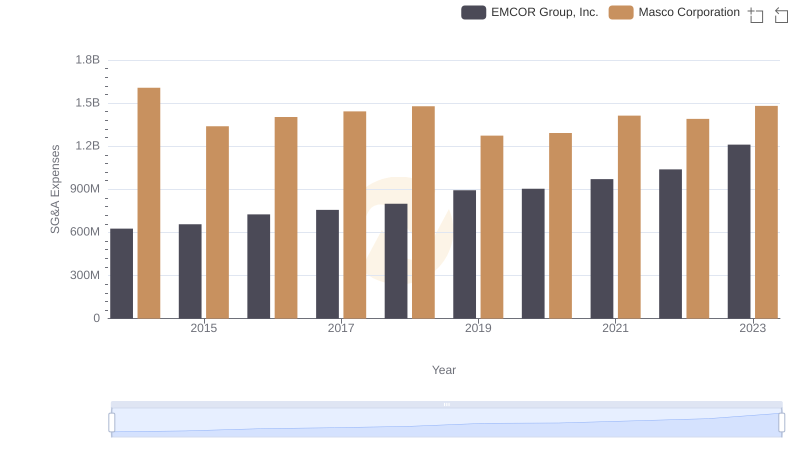
SG&A Efficiency Analysis: Comparing EMCOR Group, Inc. and Masco Corporation
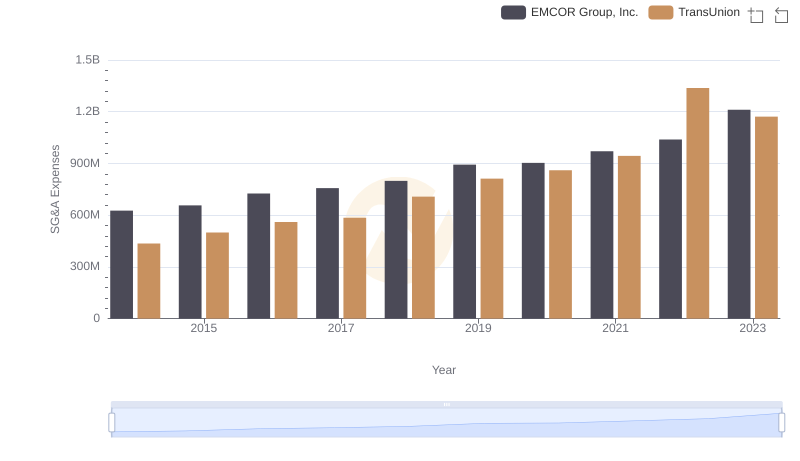
EMCOR Group, Inc. vs TransUnion: SG&A Expense Trends
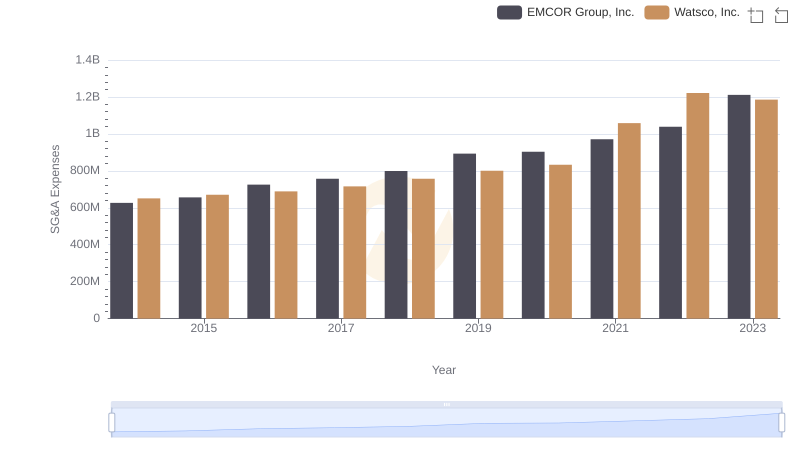
Cost Management Insights: SG&A Expenses for EMCOR Group, Inc. and Watsco, Inc.

Breaking Down SG&A Expenses: EMCOR Group, Inc. vs J.B. Hunt Transport Services, Inc.
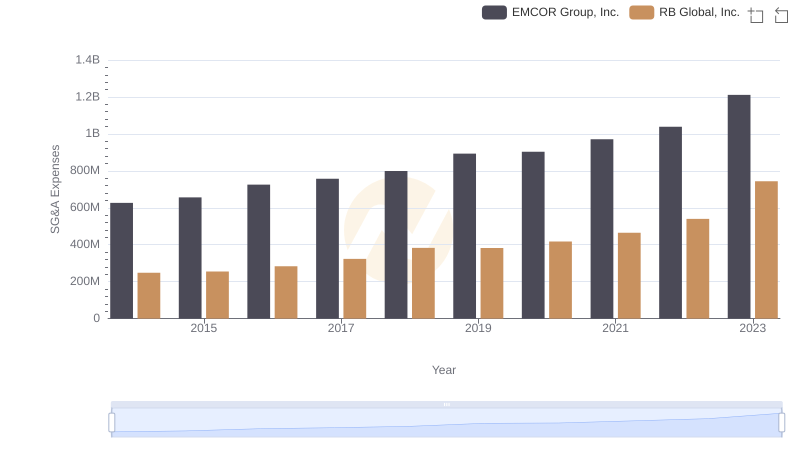
EMCOR Group, Inc. and RB Global, Inc.: SG&A Spending Patterns Compared