| __timestamp | Curtiss-Wright Corporation | EMCOR Group, Inc. |
|---|---|---|
| Wednesday, January 1, 2014 | 426301000 | 626478000 |
| Thursday, January 1, 2015 | 411801000 | 656573000 |
| Friday, January 1, 2016 | 383793000 | 725538000 |
| Sunday, January 1, 2017 | 418544000 | 757062000 |
| Monday, January 1, 2018 | 433110000 | 799157000 |
| Tuesday, January 1, 2019 | 422272000 | 893453000 |
| Wednesday, January 1, 2020 | 412825000 | 903584000 |
| Friday, January 1, 2021 | 443096000 | 970937000 |
| Saturday, January 1, 2022 | 445679000 | 1038717000 |
| Sunday, January 1, 2023 | 496812000 | 1211233000 |
| Monday, January 1, 2024 | 518857000 |
Data in motion
In the ever-evolving landscape of corporate finance, understanding the trends in Selling, General, and Administrative (SG&A) expenses is crucial for investors and analysts alike. Over the past decade, EMCOR Group, Inc. and Curtiss-Wright Corporation have showcased distinct trajectories in their SG&A expenditures.
From 2014 to 2023, EMCOR Group, Inc. has seen a remarkable increase of approximately 93% in its SG&A expenses, reflecting its aggressive growth and expansion strategies. In contrast, Curtiss-Wright Corporation's SG&A expenses have grown by about 17%, indicating a more conservative approach. Notably, in 2023, EMCOR's SG&A expenses were nearly double those of Curtiss-Wright, highlighting the divergent paths these companies have taken.
This analysis provides a window into the strategic priorities of these industry giants, offering valuable insights for stakeholders looking to understand the financial dynamics at play.
Comparing Revenue Performance: EMCOR Group, Inc. or Curtiss-Wright Corporation?
Comparing Cost of Revenue Efficiency: EMCOR Group, Inc. vs Curtiss-Wright Corporation
EMCOR Group, Inc. and Curtiss-Wright Corporation: A Detailed Gross Profit Analysis
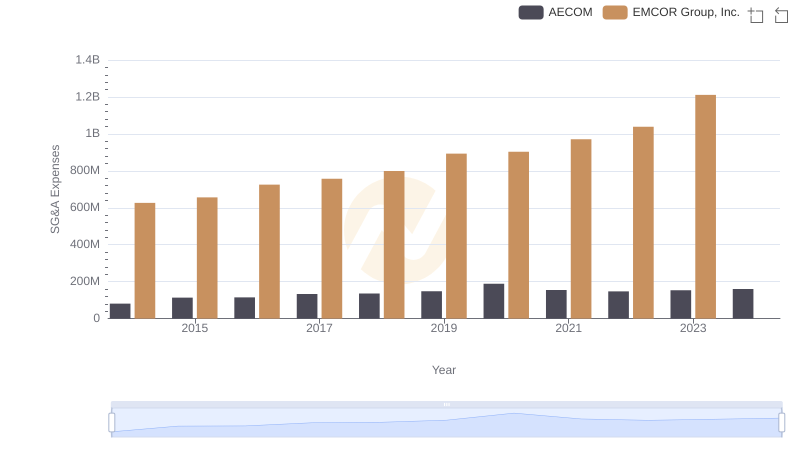
Comparing SG&A Expenses: EMCOR Group, Inc. vs AECOM Trends and Insights
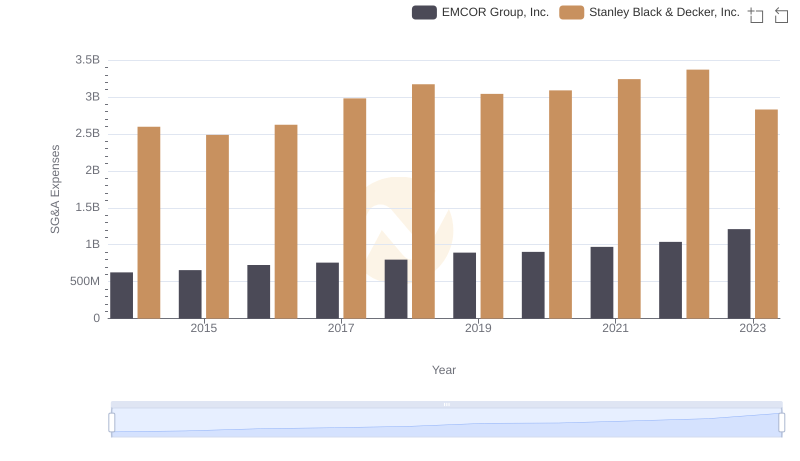
Selling, General, and Administrative Costs: EMCOR Group, Inc. vs Stanley Black & Decker, Inc.
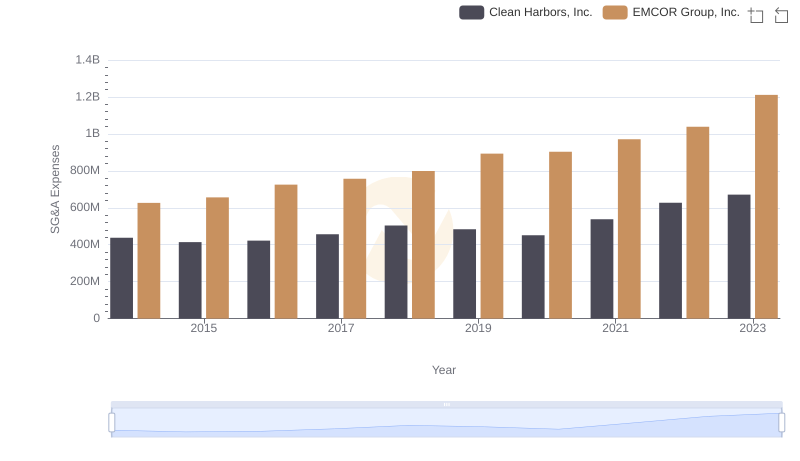
EMCOR Group, Inc. and Clean Harbors, Inc.: SG&A Spending Patterns Compared
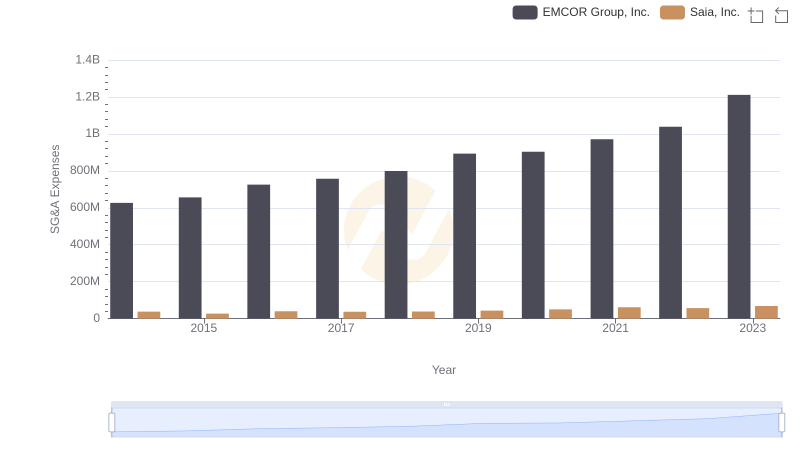
SG&A Efficiency Analysis: Comparing EMCOR Group, Inc. and Saia, Inc.
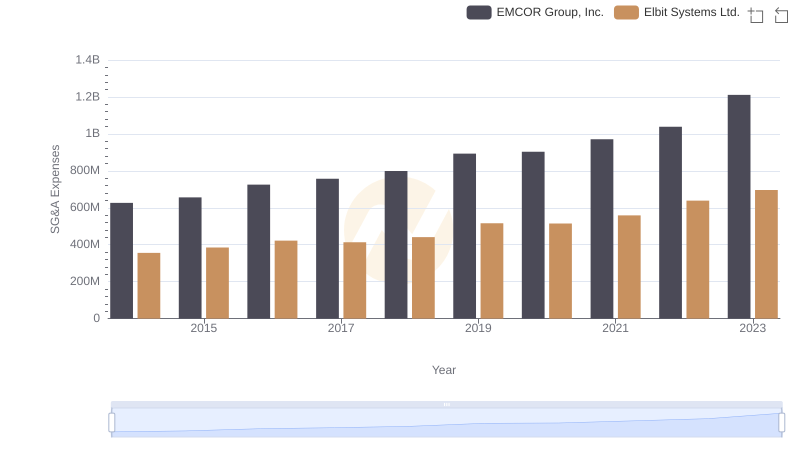
Breaking Down SG&A Expenses: EMCOR Group, Inc. vs Elbit Systems Ltd.
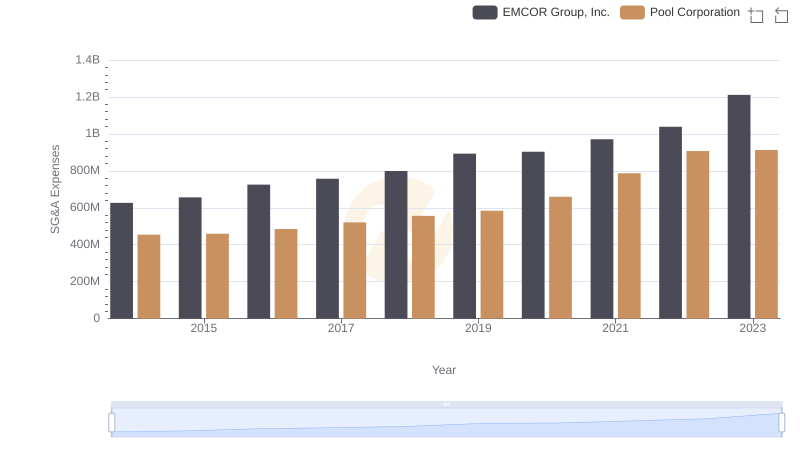
EMCOR Group, Inc. vs Pool Corporation: SG&A Expense Trends
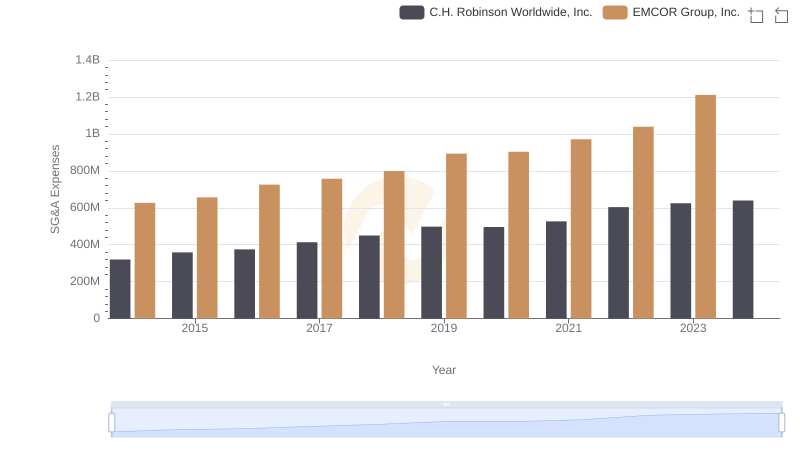
EMCOR Group, Inc. or C.H. Robinson Worldwide, Inc.: Who Manages SG&A Costs Better?
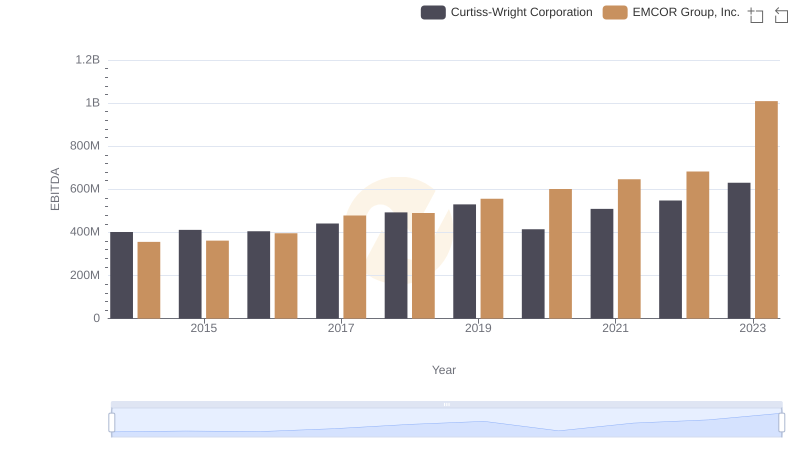
EBITDA Metrics Evaluated: EMCOR Group, Inc. vs Curtiss-Wright Corporation