| __timestamp | EMCOR Group, Inc. | Waste Management, Inc. |
|---|---|---|
| Wednesday, January 1, 2014 | 355858000 | 3509000000 |
| Thursday, January 1, 2015 | 362095000 | 3342000000 |
| Friday, January 1, 2016 | 395913000 | 3713000000 |
| Sunday, January 1, 2017 | 478459000 | 3996000000 |
| Monday, January 1, 2018 | 489954000 | 4212000000 |
| Tuesday, January 1, 2019 | 556055000 | 4344000000 |
| Wednesday, January 1, 2020 | 601449000 | 4149000000 |
| Friday, January 1, 2021 | 646861000 | 4956000000 |
| Saturday, January 1, 2022 | 682399000 | 5466000000 |
| Sunday, January 1, 2023 | 1009017000 | 5592000000 |
| Monday, January 1, 2024 | 5128000000 |
Unleashing insights
In the ever-evolving landscape of corporate finance, EBITDA serves as a crucial indicator of a company's operational efficiency. Over the past decade, Waste Management, Inc. and EMCOR Group, Inc. have demonstrated remarkable growth in this metric. From 2014 to 2023, Waste Management's EBITDA surged by approximately 59%, reflecting its robust market position and strategic initiatives. In contrast, EMCOR Group experienced a staggering 184% increase, showcasing its dynamic expansion and adaptability in the industry.
This comparative analysis underscores the diverse strategies and market conditions influencing these industry giants, offering valuable insights for investors and stakeholders.
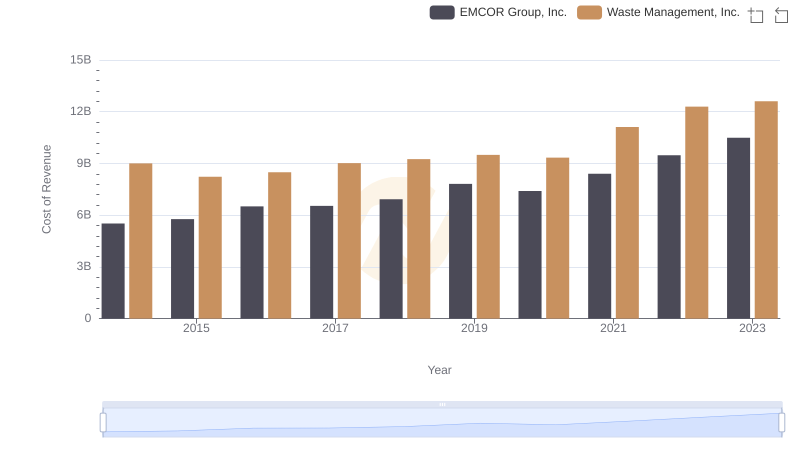
Cost Insights: Breaking Down Waste Management, Inc. and EMCOR Group, Inc.'s Expenses
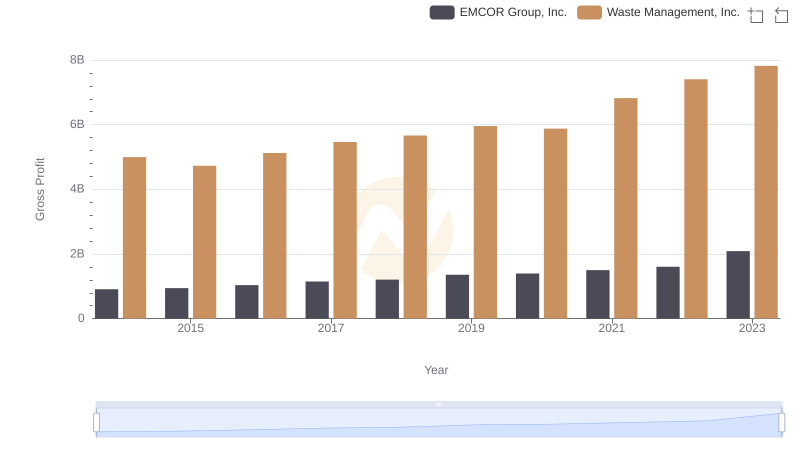
Gross Profit Analysis: Comparing Waste Management, Inc. and EMCOR Group, Inc.
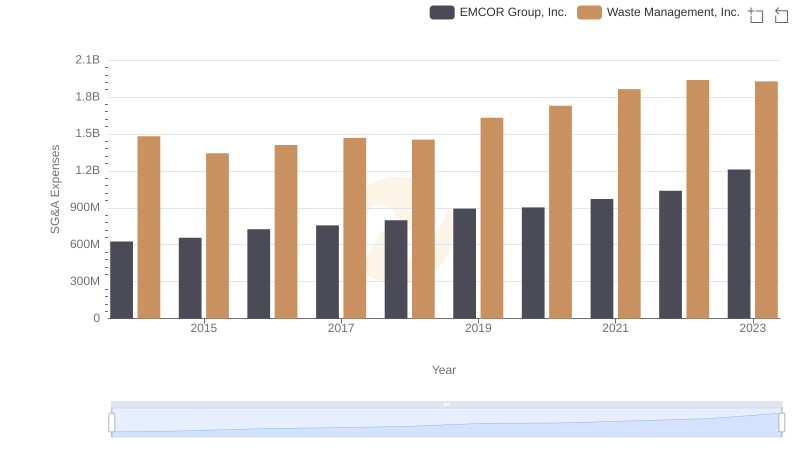
Waste Management, Inc. and EMCOR Group, Inc.: SG&A Spending Patterns Compared
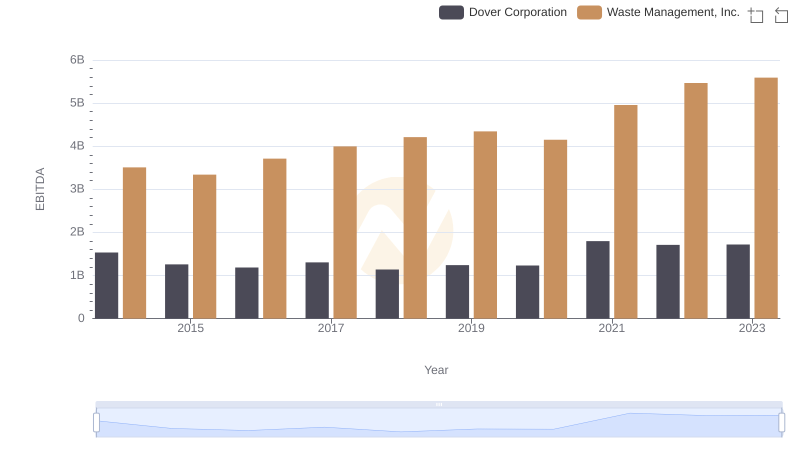
EBITDA Performance Review: Waste Management, Inc. vs Dover Corporation
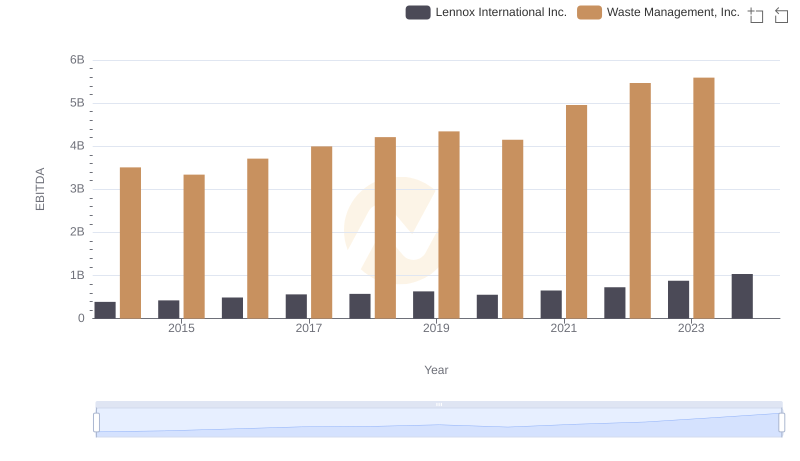
A Side-by-Side Analysis of EBITDA: Waste Management, Inc. and Lennox International Inc.
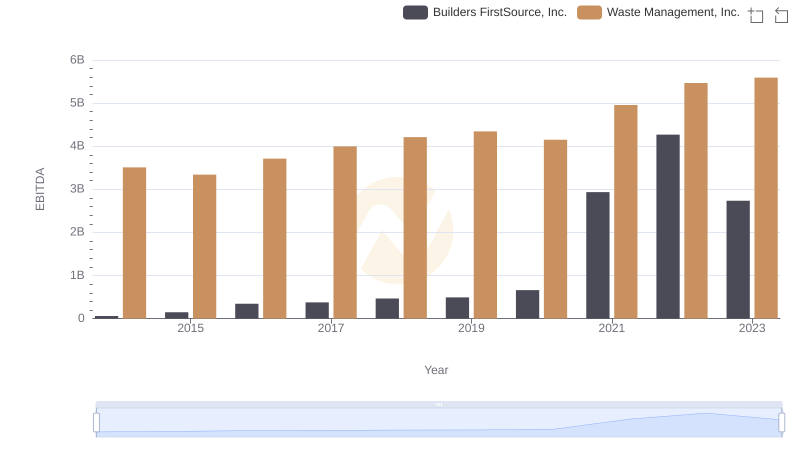
EBITDA Performance Review: Waste Management, Inc. vs Builders FirstSource, Inc.
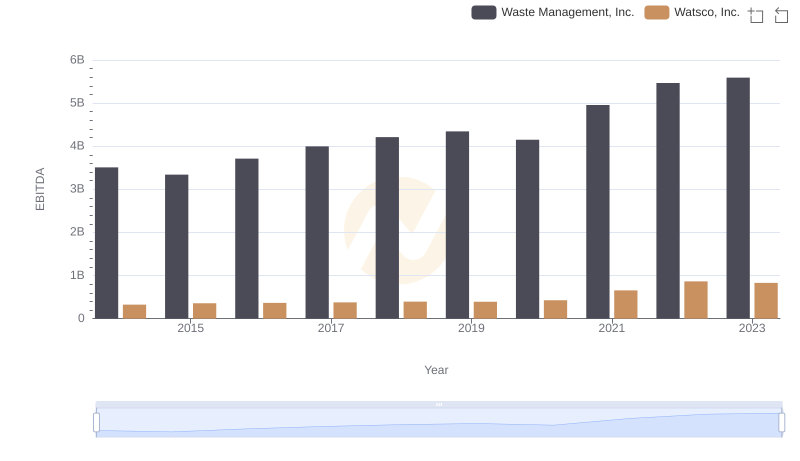
Professional EBITDA Benchmarking: Waste Management, Inc. vs Watsco, Inc.
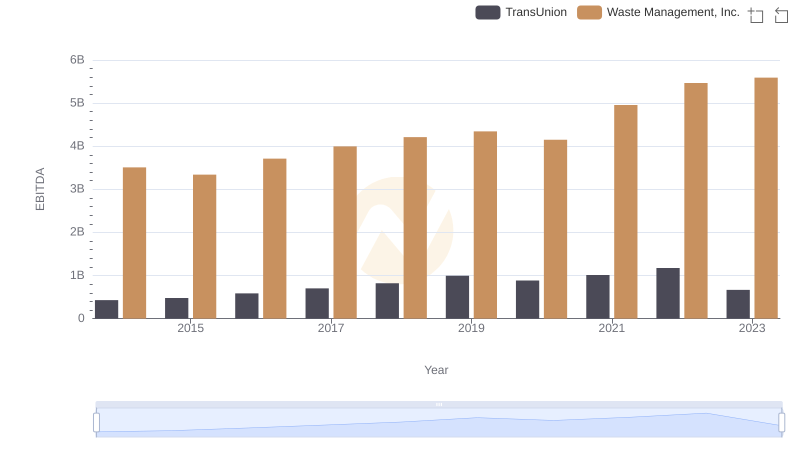
A Professional Review of EBITDA: Waste Management, Inc. Compared to TransUnion
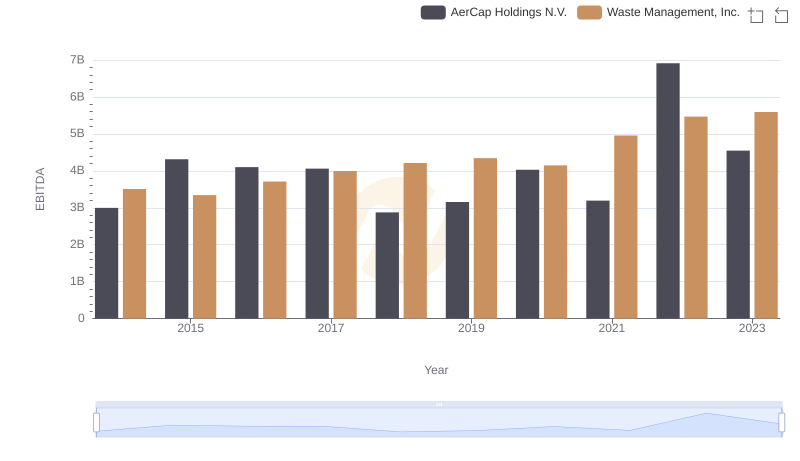
Professional EBITDA Benchmarking: Waste Management, Inc. vs AerCap Holdings N.V.