| __timestamp | Dover Corporation | Waste Management, Inc. |
|---|---|---|
| Wednesday, January 1, 2014 | 1533084000 | 3509000000 |
| Thursday, January 1, 2015 | 1259375000 | 3342000000 |
| Friday, January 1, 2016 | 1186472000 | 3713000000 |
| Sunday, January 1, 2017 | 1304041000 | 3996000000 |
| Monday, January 1, 2018 | 1138930000 | 4212000000 |
| Tuesday, January 1, 2019 | 1241114000 | 4344000000 |
| Wednesday, January 1, 2020 | 1232722000 | 4149000000 |
| Friday, January 1, 2021 | 1797268000 | 4956000000 |
| Saturday, January 1, 2022 | 1711499000 | 5466000000 |
| Sunday, January 1, 2023 | 1718774000 | 5592000000 |
| Monday, January 1, 2024 | 1206355000 | 5128000000 |
Unveiling the hidden dimensions of data
In the ever-evolving landscape of corporate finance, EBITDA serves as a crucial indicator of a company's operational performance. Over the past decade, Waste Management, Inc. and Dover Corporation have showcased intriguing trajectories in their EBITDA growth. From 2014 to 2023, Waste Management, Inc. has consistently outperformed Dover Corporation, with an average EBITDA nearly three times higher. Notably, Waste Management, Inc. saw a remarkable 59% increase in EBITDA, peaking in 2023, while Dover Corporation experienced a more modest 12% growth over the same period.
This performance highlights Waste Management, Inc.'s robust operational efficiency and strategic positioning in the waste management sector. Meanwhile, Dover Corporation's steady growth reflects its resilience and adaptability in the industrial products market. As we look to the future, these trends offer valuable insights into the financial health and strategic direction of these industry leaders.
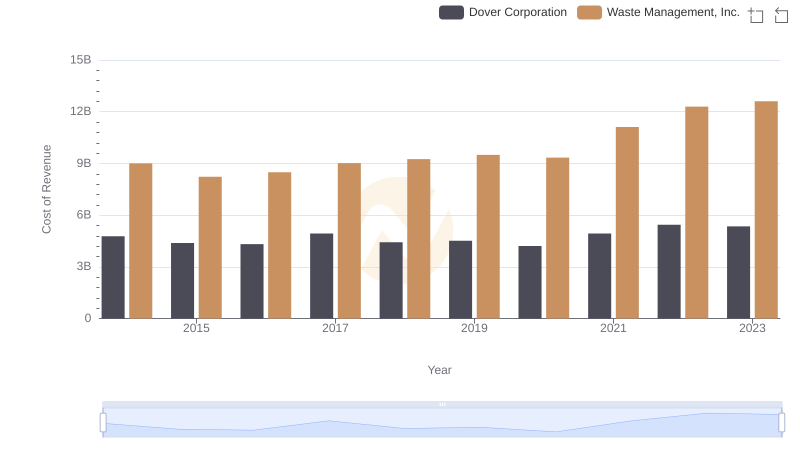
Comparing Cost of Revenue Efficiency: Waste Management, Inc. vs Dover Corporation
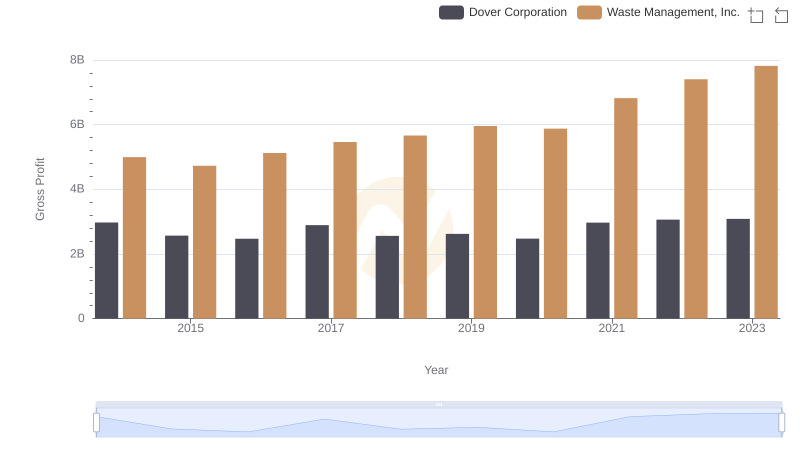
Waste Management, Inc. and Dover Corporation: A Detailed Gross Profit Analysis
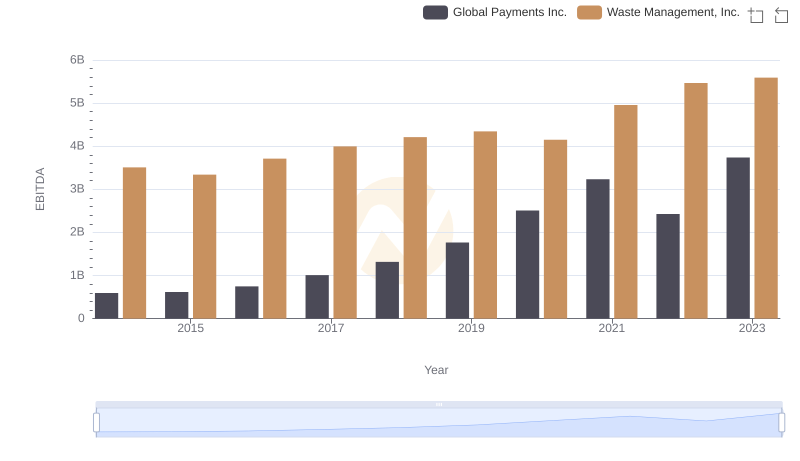
A Professional Review of EBITDA: Waste Management, Inc. Compared to Global Payments Inc.
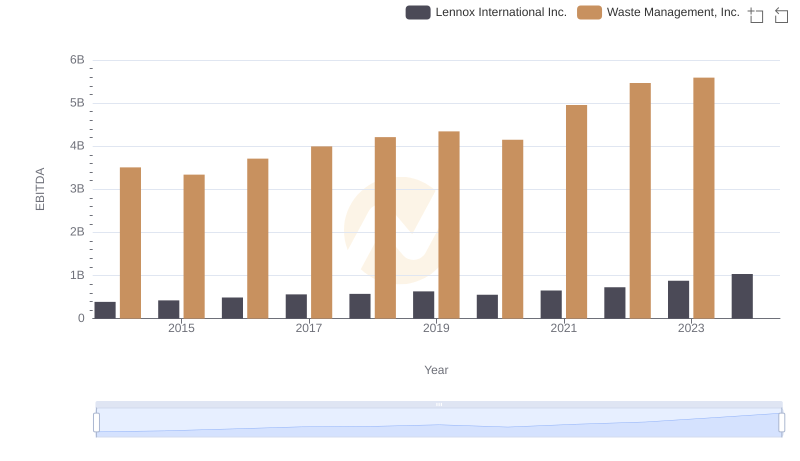
A Side-by-Side Analysis of EBITDA: Waste Management, Inc. and Lennox International Inc.
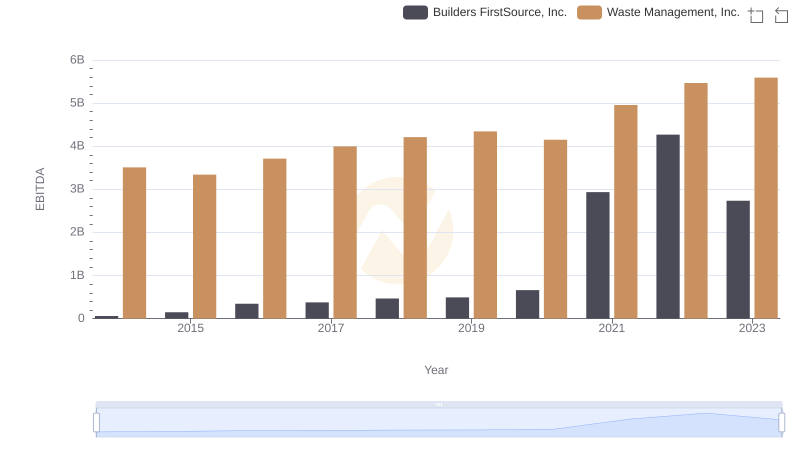
EBITDA Performance Review: Waste Management, Inc. vs Builders FirstSource, Inc.
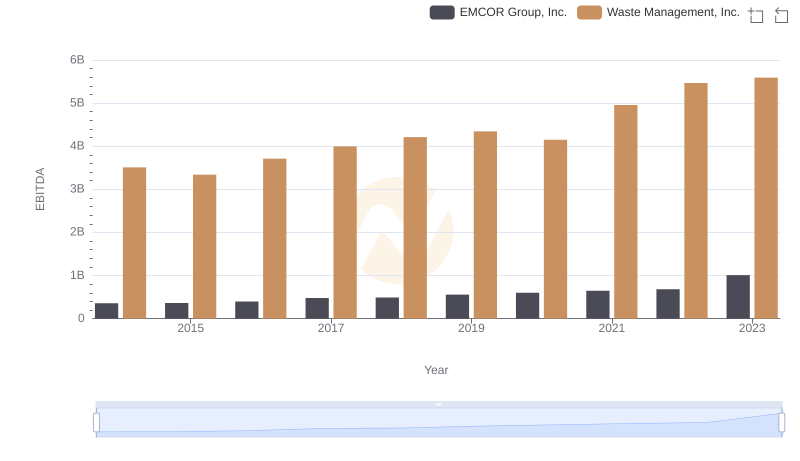
Comprehensive EBITDA Comparison: Waste Management, Inc. vs EMCOR Group, Inc.
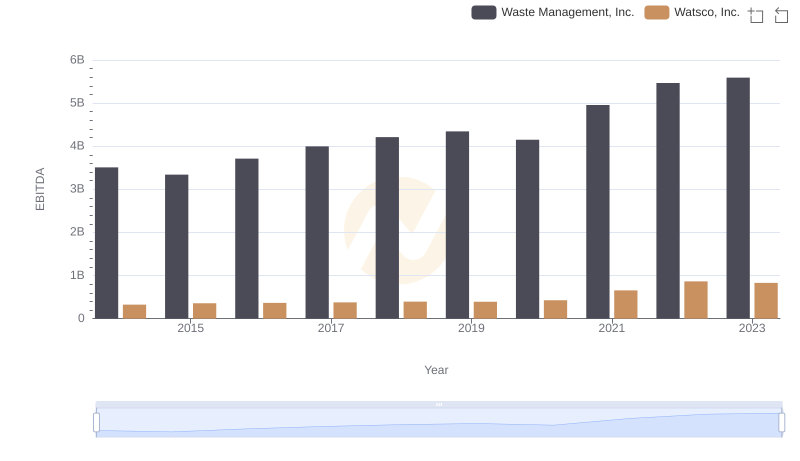
Professional EBITDA Benchmarking: Waste Management, Inc. vs Watsco, Inc.