| __timestamp | Rockwell Automation, Inc. | Waste Connections, Inc. |
|---|---|---|
| Wednesday, January 1, 2014 | 1346000000 | 717805000 |
| Thursday, January 1, 2015 | 1359100000 | 191002871 |
| Friday, January 1, 2016 | 1200700000 | 900371894 |
| Sunday, January 1, 2017 | 1258400000 | 1380632000 |
| Monday, January 1, 2018 | 1568400000 | 1442229014 |
| Tuesday, January 1, 2019 | 1150200000 | 1650754605 |
| Wednesday, January 1, 2020 | 1410200000 | 1597555000 |
| Friday, January 1, 2021 | 1808300000 | 1891001000 |
| Saturday, January 1, 2022 | 1432100000 | 2090554149 |
| Sunday, January 1, 2023 | 1990700000 | 2261354000 |
| Monday, January 1, 2024 | 1567500000 | 2389779000 |
Unveiling the hidden dimensions of data
In the ever-evolving landscape of industrial giants, Waste Connections, Inc. and Rockwell Automation, Inc. have showcased remarkable EBITDA growth over the past decade. From 2014 to 2023, Waste Connections, Inc. has seen its EBITDA soar by approximately 215%, peaking at an impressive $2.26 billion in 2023. This growth trajectory highlights the company's strategic expansions and operational efficiencies.
Conversely, Rockwell Automation, Inc. has demonstrated steady growth, with its EBITDA increasing by around 48% over the same period, reaching a high of $1.99 billion in 2023. This consistent performance underscores Rockwell's resilience and adaptability in the face of market fluctuations.
While Waste Connections, Inc. experienced a significant leap in 2019, Rockwell Automation, Inc. maintained a more stable growth pattern. The data for 2024 remains incomplete, leaving room for speculation on future trends. This analysis offers a compelling glimpse into the financial health and strategic prowess of these industry leaders.
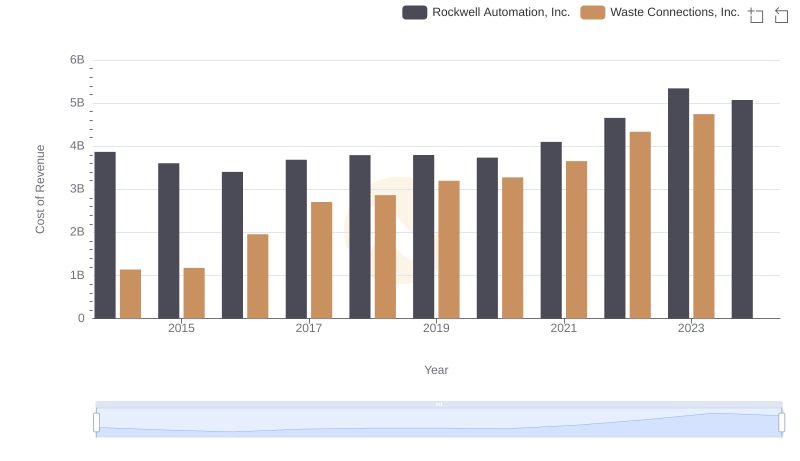
Cost of Revenue: Key Insights for Waste Connections, Inc. and Rockwell Automation, Inc.
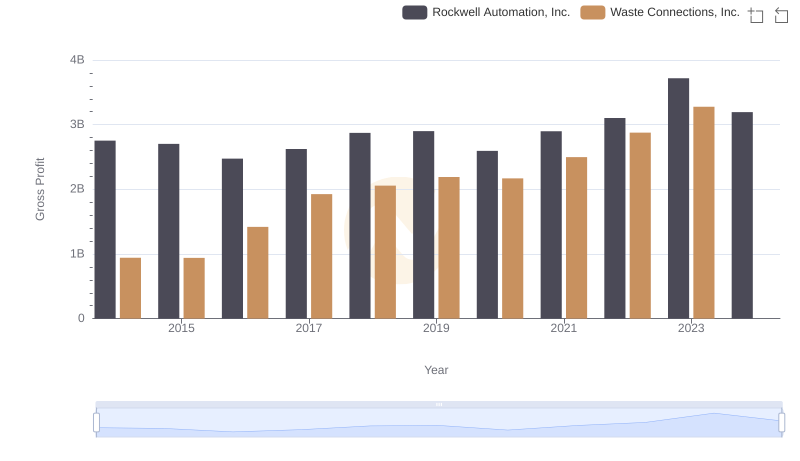
Waste Connections, Inc. and Rockwell Automation, Inc.: A Detailed Gross Profit Analysis
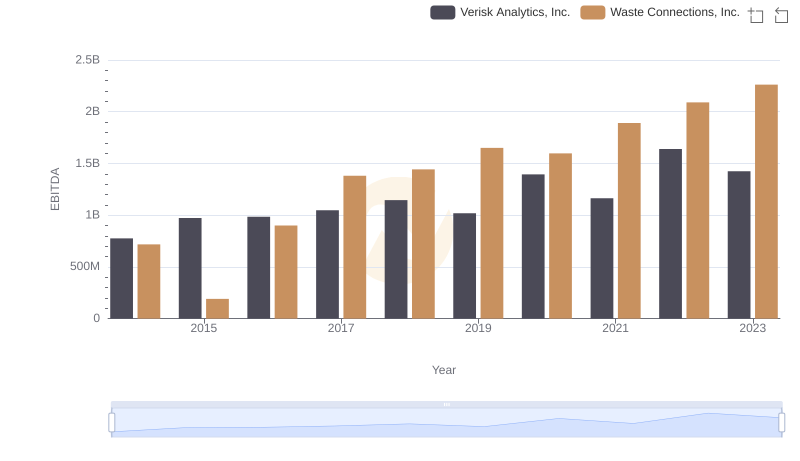
EBITDA Performance Review: Waste Connections, Inc. vs Verisk Analytics, Inc.
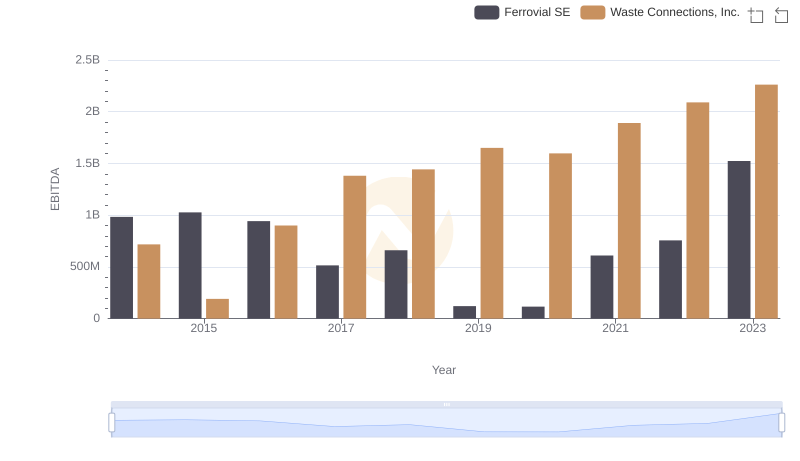
EBITDA Performance Review: Waste Connections, Inc. vs Ferrovial SE

Cost Management Insights: SG&A Expenses for Waste Connections, Inc. and Rockwell Automation, Inc.
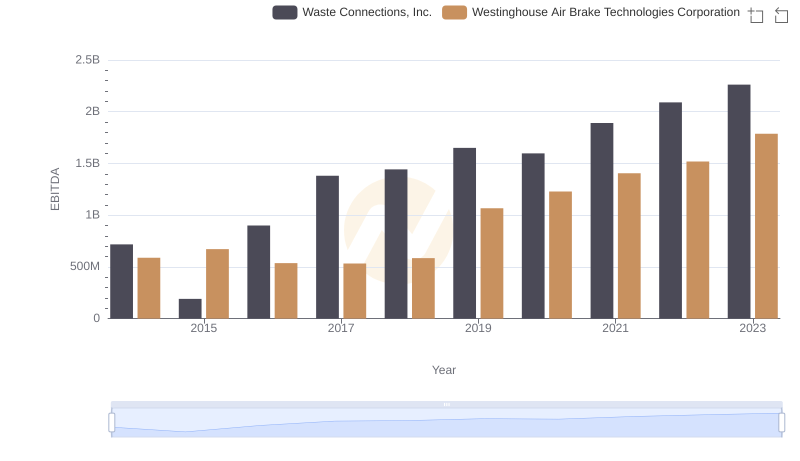
EBITDA Performance Review: Waste Connections, Inc. vs Westinghouse Air Brake Technologies Corporation
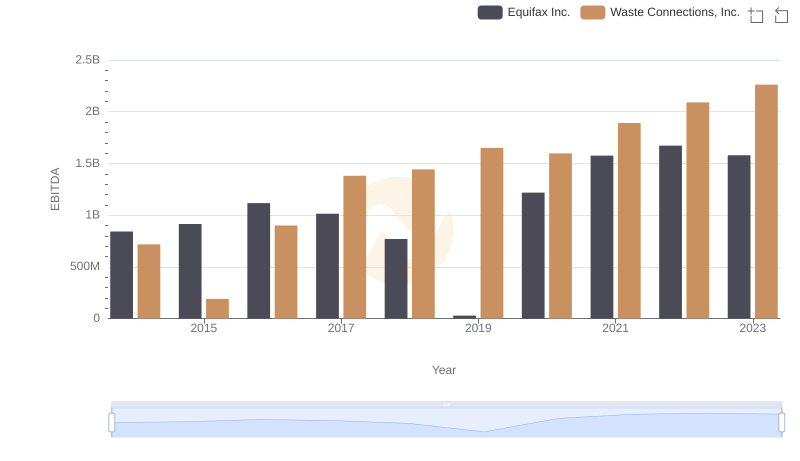
Professional EBITDA Benchmarking: Waste Connections, Inc. vs Equifax Inc.
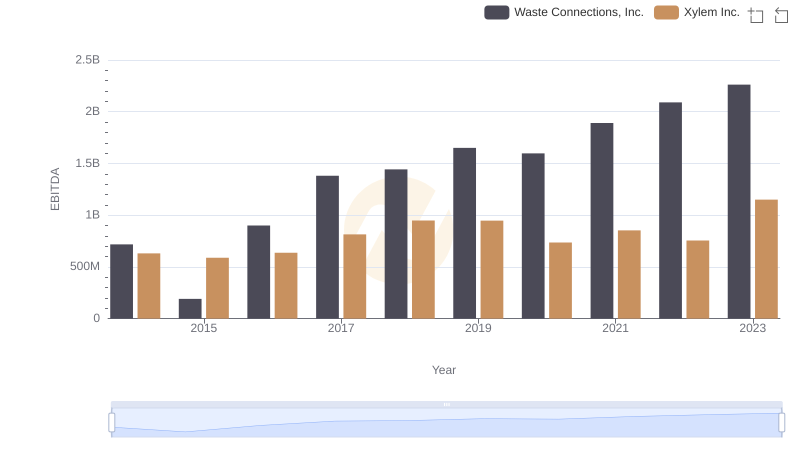
Comprehensive EBITDA Comparison: Waste Connections, Inc. vs Xylem Inc.
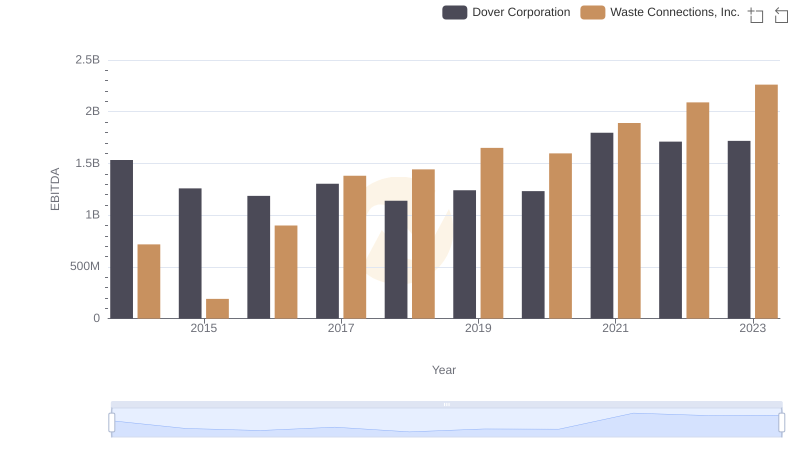
EBITDA Analysis: Evaluating Waste Connections, Inc. Against Dover Corporation
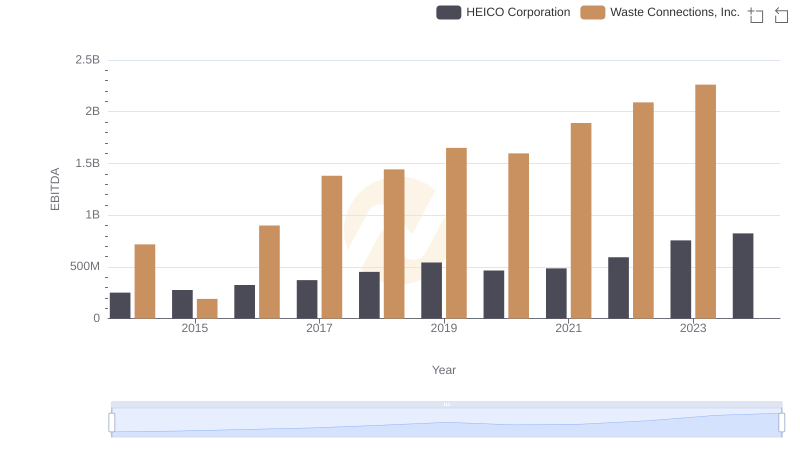
EBITDA Performance Review: Waste Connections, Inc. vs HEICO Corporation