| __timestamp | Waste Connections, Inc. | Xylem Inc. |
|---|---|---|
| Wednesday, January 1, 2014 | 717805000 | 631000000 |
| Thursday, January 1, 2015 | 191002871 | 588000000 |
| Friday, January 1, 2016 | 900371894 | 637000000 |
| Sunday, January 1, 2017 | 1380632000 | 814000000 |
| Monday, January 1, 2018 | 1442229014 | 948000000 |
| Tuesday, January 1, 2019 | 1650754605 | 947000000 |
| Wednesday, January 1, 2020 | 1597555000 | 736000000 |
| Friday, January 1, 2021 | 1891001000 | 853000000 |
| Saturday, January 1, 2022 | 2090554149 | 755000000 |
| Sunday, January 1, 2023 | 2261354000 | 1150000000 |
| Monday, January 1, 2024 | 2389779000 |
Igniting the spark of knowledge
In the ever-evolving landscape of environmental services and water technology, Waste Connections, Inc. and Xylem Inc. have emerged as industry leaders. Over the past decade, Waste Connections has demonstrated a remarkable growth trajectory, with its EBITDA increasing by over 215% from 2014 to 2023. This growth underscores the company's strategic acquisitions and operational efficiencies. In contrast, Xylem Inc. has shown a steady, albeit slower, growth of approximately 82% during the same period, reflecting its focus on sustainable water solutions and innovation.
The year 2023 marked a significant milestone, with Waste Connections achieving an EBITDA of 2.26 billion, nearly double that of Xylem's 1.15 billion. This comparison highlights the diverse strategies and market dynamics influencing these two giants. As the world pivots towards sustainability, both companies are poised to play pivotal roles in shaping the future of their respective industries.
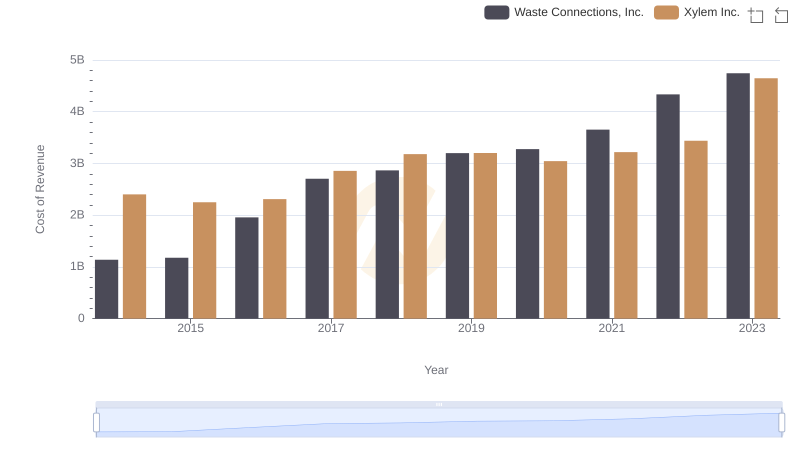
Cost of Revenue: Key Insights for Waste Connections, Inc. and Xylem Inc.
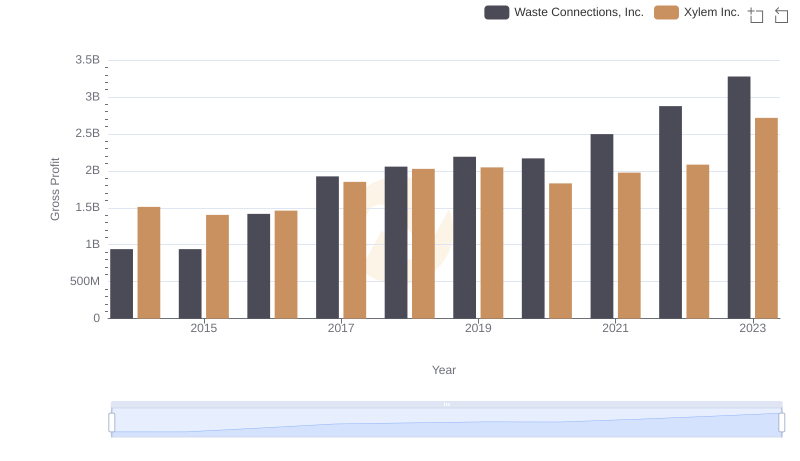
Waste Connections, Inc. vs Xylem Inc.: A Gross Profit Performance Breakdown
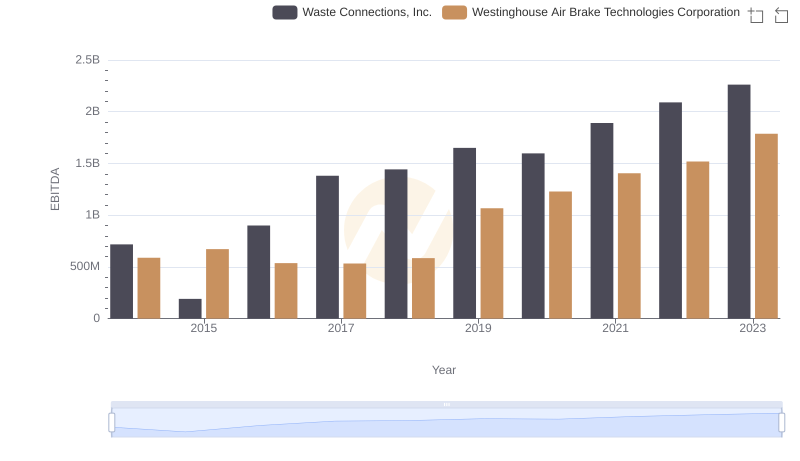
EBITDA Performance Review: Waste Connections, Inc. vs Westinghouse Air Brake Technologies Corporation
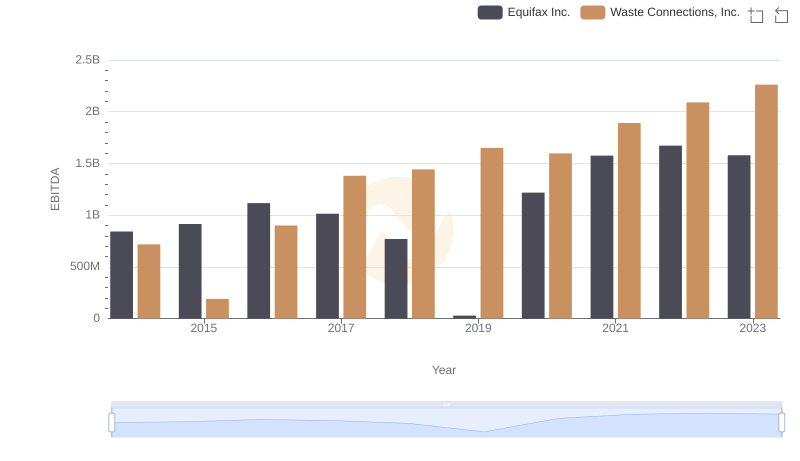
Professional EBITDA Benchmarking: Waste Connections, Inc. vs Equifax Inc.
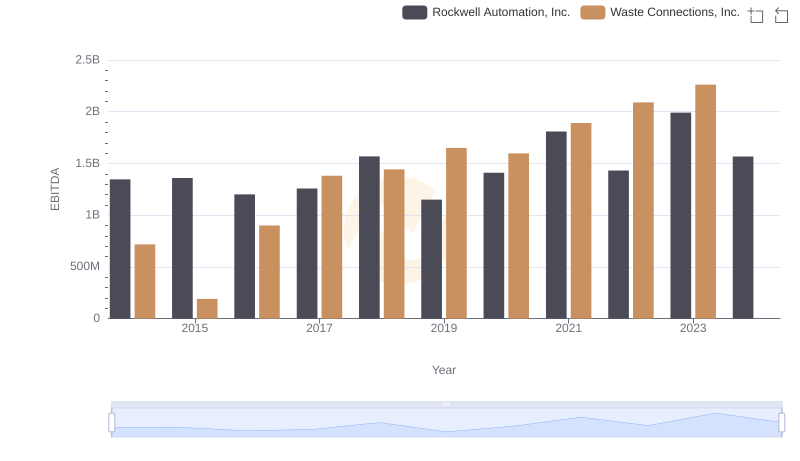
EBITDA Performance Review: Waste Connections, Inc. vs Rockwell Automation, Inc.
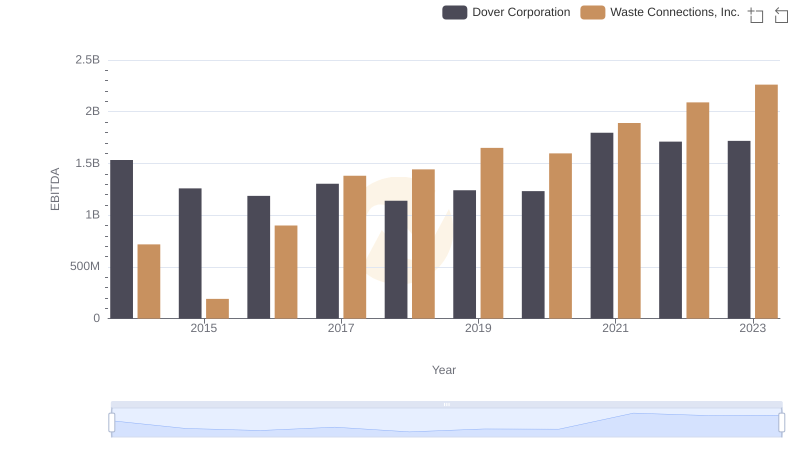
EBITDA Analysis: Evaluating Waste Connections, Inc. Against Dover Corporation
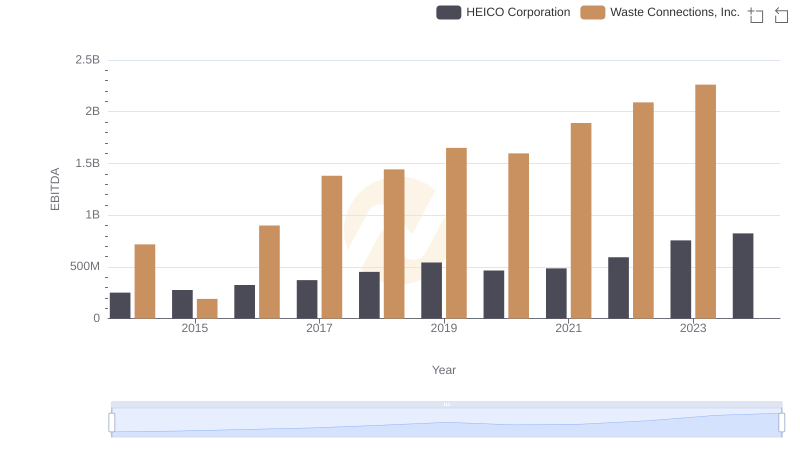
EBITDA Performance Review: Waste Connections, Inc. vs HEICO Corporation
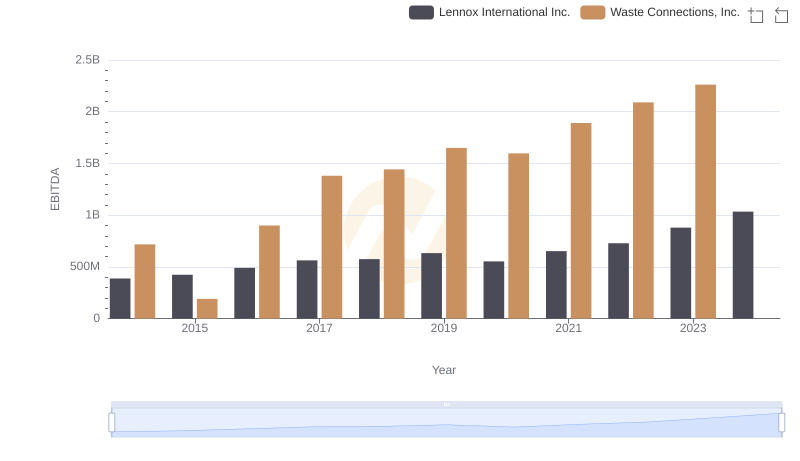
A Side-by-Side Analysis of EBITDA: Waste Connections, Inc. and Lennox International Inc.
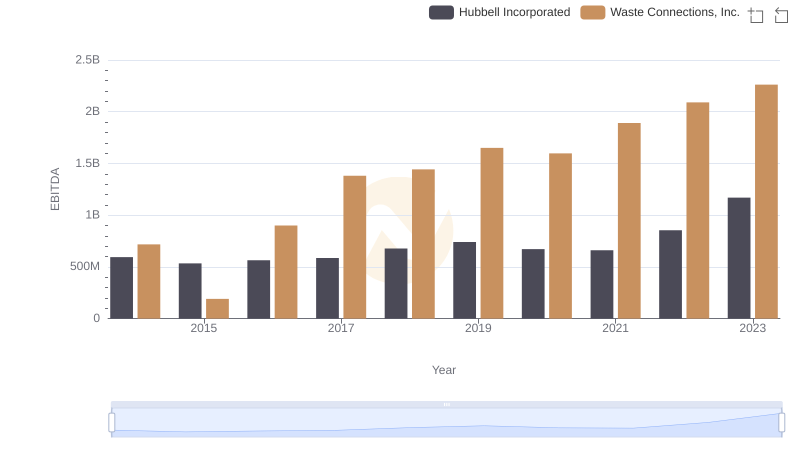
Waste Connections, Inc. vs Hubbell Incorporated: In-Depth EBITDA Performance Comparison