| __timestamp | Rockwell Automation, Inc. | Waste Connections, Inc. |
|---|---|---|
| Wednesday, January 1, 2014 | 2753900000 | 940778000 |
| Thursday, January 1, 2015 | 2703100000 | 939878000 |
| Friday, January 1, 2016 | 2475500000 | 1418151000 |
| Sunday, January 1, 2017 | 2624200000 | 1925713000 |
| Monday, January 1, 2018 | 2872200000 | 2057237000 |
| Tuesday, January 1, 2019 | 2900100000 | 2189922000 |
| Wednesday, January 1, 2020 | 2595200000 | 2169182000 |
| Friday, January 1, 2021 | 2897700000 | 2497287000 |
| Saturday, January 1, 2022 | 3102000000 | 2875847000 |
| Sunday, January 1, 2023 | 3717000000 | 3277438000 |
| Monday, January 1, 2024 | 3193400000 | 3727885000 |
Igniting the spark of knowledge
In the ever-evolving landscape of industrial giants, Waste Connections, Inc. and Rockwell Automation, Inc. have showcased intriguing financial trajectories over the past decade. From 2014 to 2023, Rockwell Automation's gross profit surged by approximately 35%, peaking in 2023. Meanwhile, Waste Connections demonstrated a remarkable growth of nearly 250% in the same period, reflecting its robust expansion strategy.
This analysis highlights the dynamic nature of these companies' financial health, offering valuable insights for investors and industry analysts alike. However, data for 2024 remains incomplete, suggesting a need for cautious optimism.
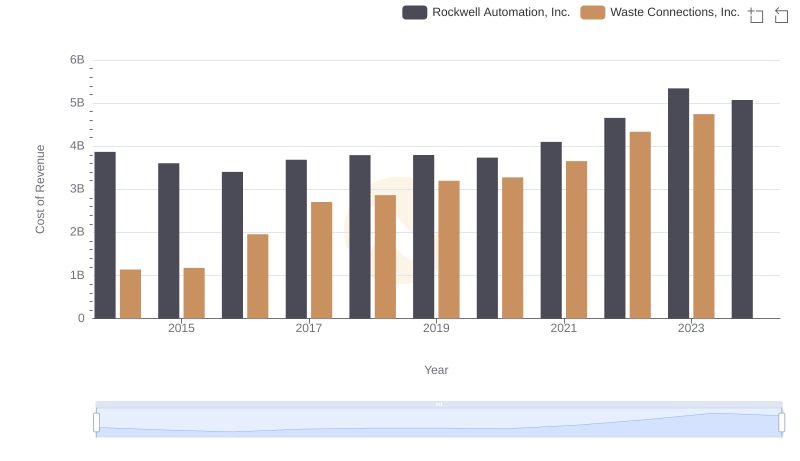
Cost of Revenue: Key Insights for Waste Connections, Inc. and Rockwell Automation, Inc.

Waste Connections, Inc. vs Ferrovial SE: A Gross Profit Performance Breakdown
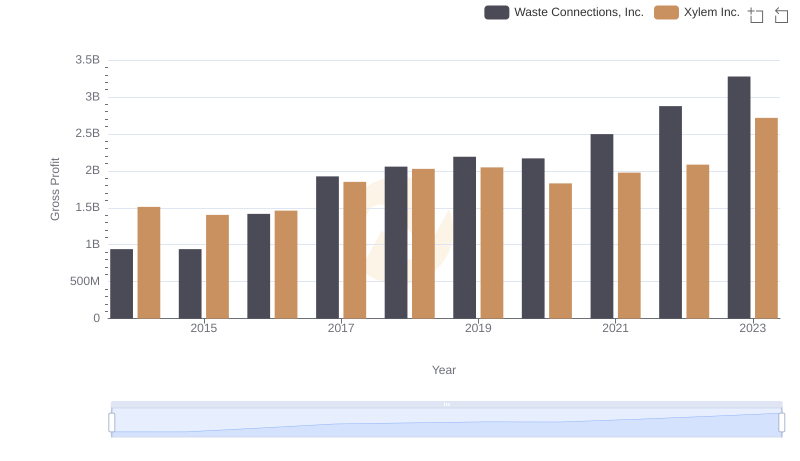
Waste Connections, Inc. vs Xylem Inc.: A Gross Profit Performance Breakdown
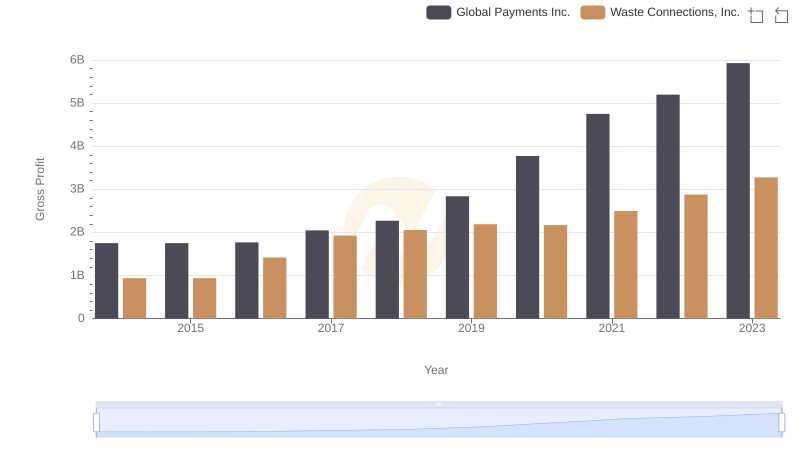
Gross Profit Trends Compared: Waste Connections, Inc. vs Global Payments Inc.

Cost Management Insights: SG&A Expenses for Waste Connections, Inc. and Rockwell Automation, Inc.
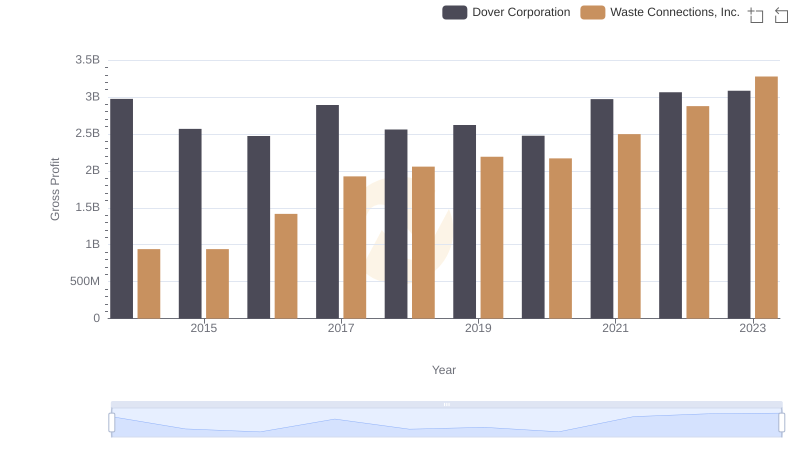
Waste Connections, Inc. and Dover Corporation: A Detailed Gross Profit Analysis
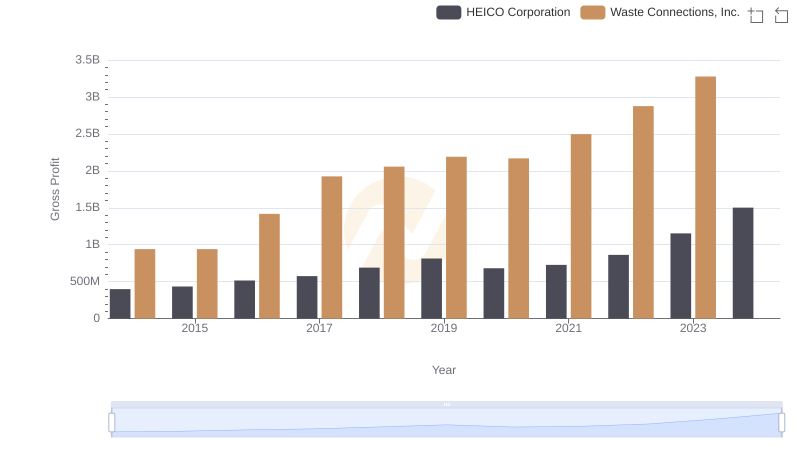
Gross Profit Analysis: Comparing Waste Connections, Inc. and HEICO Corporation
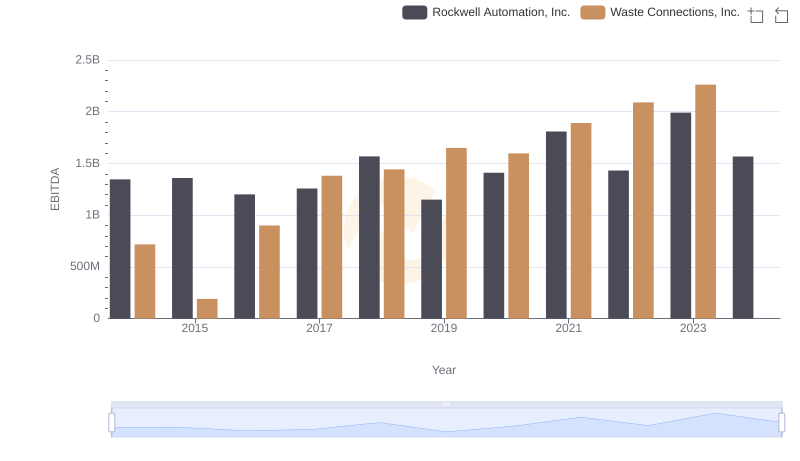
EBITDA Performance Review: Waste Connections, Inc. vs Rockwell Automation, Inc.