| __timestamp | Rockwell Automation, Inc. | Waste Connections, Inc. |
|---|---|---|
| Wednesday, January 1, 2014 | 1570100000 | 229474000 |
| Thursday, January 1, 2015 | 1506400000 | 237484000 |
| Friday, January 1, 2016 | 1467400000 | 474263000 |
| Sunday, January 1, 2017 | 1591500000 | 509638000 |
| Monday, January 1, 2018 | 1599000000 | 524388000 |
| Tuesday, January 1, 2019 | 1538500000 | 546278000 |
| Wednesday, January 1, 2020 | 1479800000 | 537632000 |
| Friday, January 1, 2021 | 1680000000 | 612337000 |
| Saturday, January 1, 2022 | 1766700000 | 696467000 |
| Sunday, January 1, 2023 | 2023700000 | 799119000 |
| Monday, January 1, 2024 | 2002600000 | 883445000 |
Unveiling the hidden dimensions of data
In the ever-evolving landscape of corporate finance, effective cost management is crucial. This analysis delves into the Selling, General, and Administrative (SG&A) expenses of two industry giants: Rockwell Automation, Inc. and Waste Connections, Inc., from 2014 to 2023.
Rockwell Automation has demonstrated a steady increase in SG&A expenses, peaking in 2023 with a 29% rise from 2014. This trend reflects strategic investments in innovation and market expansion.
Conversely, Waste Connections, Inc. has shown a remarkable 248% increase in SG&A expenses over the same period, highlighting its aggressive growth strategy. However, data for 2024 remains unavailable, leaving room for speculation on future trends.
This comparative analysis underscores the diverse approaches to cost management, offering valuable insights for investors and industry analysts alike.
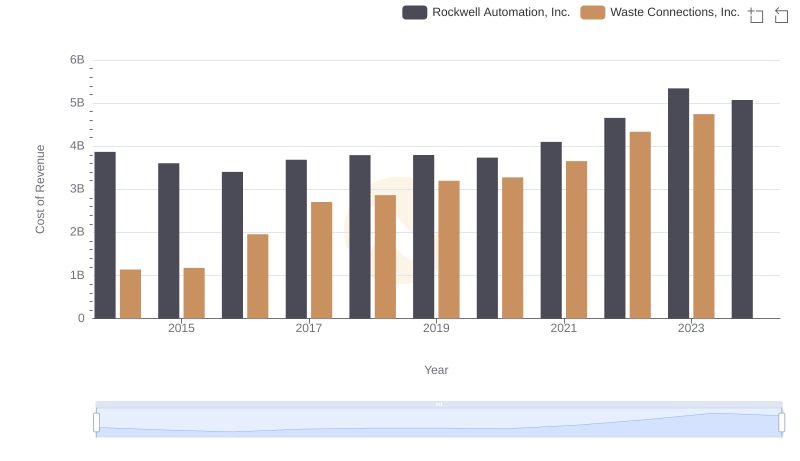
Cost of Revenue: Key Insights for Waste Connections, Inc. and Rockwell Automation, Inc.
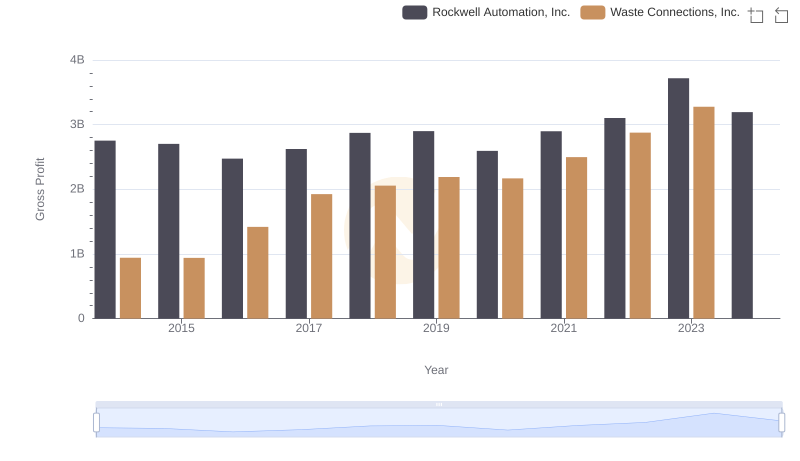
Waste Connections, Inc. and Rockwell Automation, Inc.: A Detailed Gross Profit Analysis
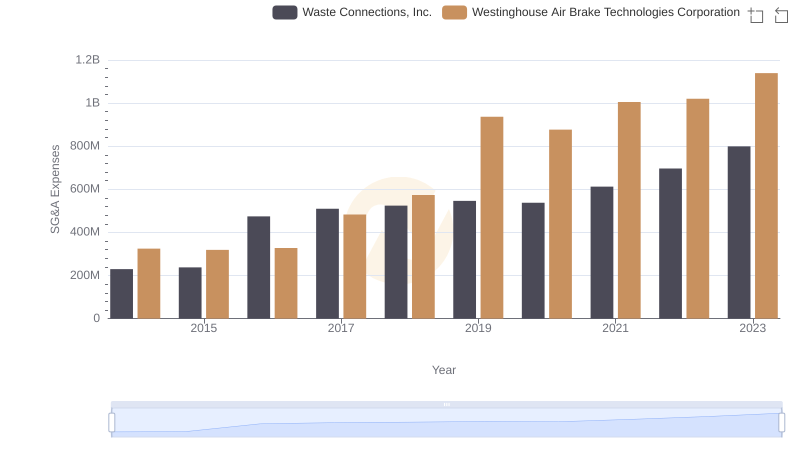
Cost Management Insights: SG&A Expenses for Waste Connections, Inc. and Westinghouse Air Brake Technologies Corporation
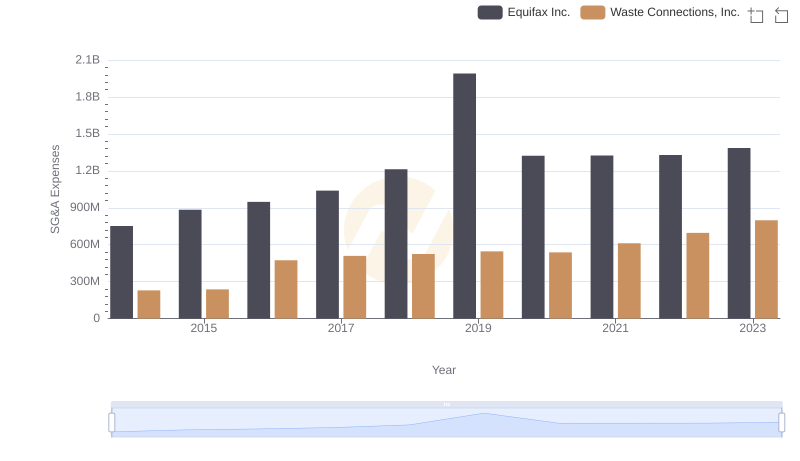
Waste Connections, Inc. and Equifax Inc.: SG&A Spending Patterns Compared
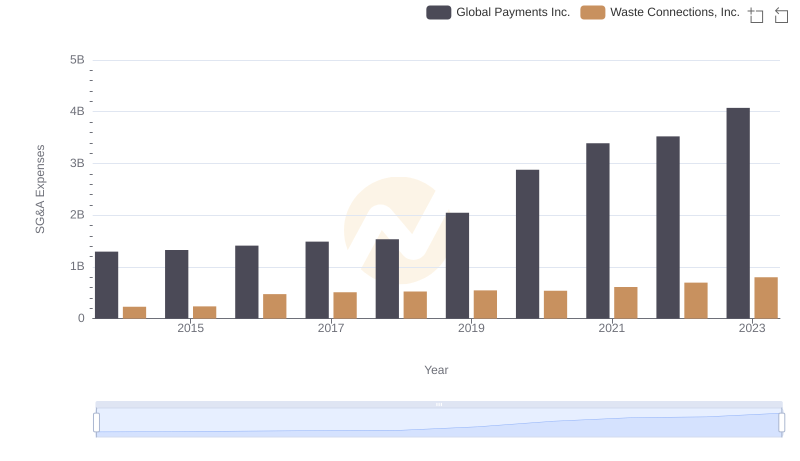
Waste Connections, Inc. and Global Payments Inc.: SG&A Spending Patterns Compared
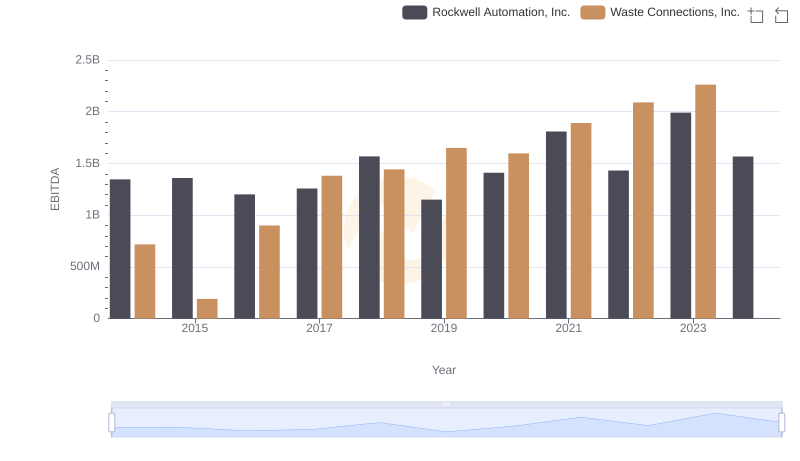
EBITDA Performance Review: Waste Connections, Inc. vs Rockwell Automation, Inc.
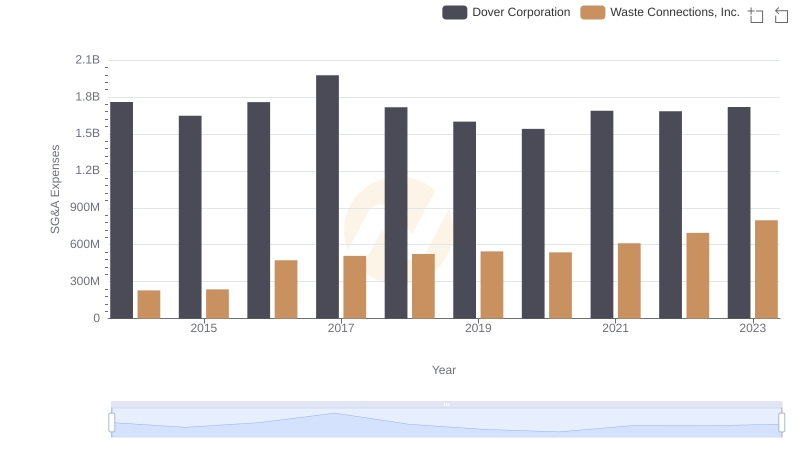
Comparing SG&A Expenses: Waste Connections, Inc. vs Dover Corporation Trends and Insights
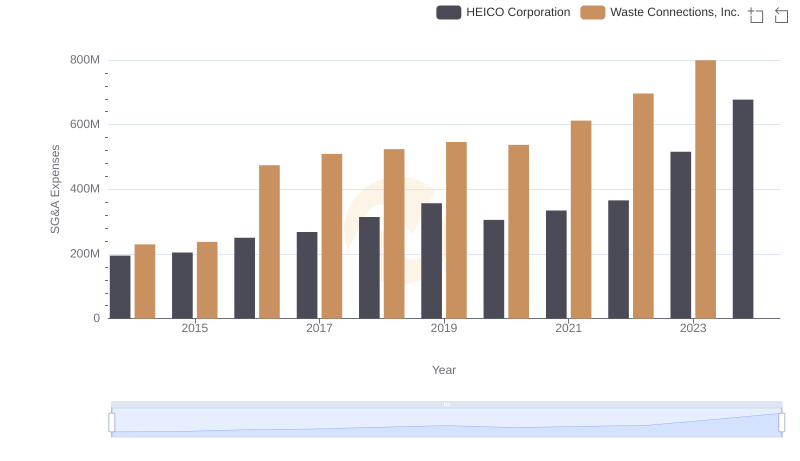
Operational Costs Compared: SG&A Analysis of Waste Connections, Inc. and HEICO Corporation