| __timestamp | CSX Corporation | Pool Corporation |
|---|---|---|
| Wednesday, January 1, 2014 | 9056000000 | 1603222000 |
| Thursday, January 1, 2015 | 8227000000 | 1687495000 |
| Friday, January 1, 2016 | 7680000000 | 1829716000 |
| Sunday, January 1, 2017 | 7635000000 | 1982899000 |
| Monday, January 1, 2018 | 7477000000 | 2127924000 |
| Tuesday, January 1, 2019 | 7063000000 | 2274592000 |
| Wednesday, January 1, 2020 | 6221000000 | 2805721000 |
| Friday, January 1, 2021 | 7382000000 | 3678492000 |
| Saturday, January 1, 2022 | 9068000000 | 4246315000 |
| Sunday, January 1, 2023 | 9130000000 | 3881551000 |
Data in motion
In the ever-evolving landscape of American industry, cost efficiency remains a pivotal factor for success. Over the past decade, CSX Corporation and Pool Corporation have demonstrated contrasting trajectories in managing their cost of revenue. From 2014 to 2023, CSX Corporation's cost of revenue fluctuated, peaking in 2023 with a 47% increase from its lowest point in 2020. Meanwhile, Pool Corporation exhibited a steady upward trend, with a remarkable 166% rise from 2014 to 2022, before a slight dip in 2023. This divergence highlights the dynamic nature of cost management strategies in different sectors. As CSX navigates the complexities of the transportation industry, Pool Corporation capitalizes on the growing demand in the leisure and lifestyle market. These insights underscore the importance of adaptive strategies in maintaining competitive advantage.
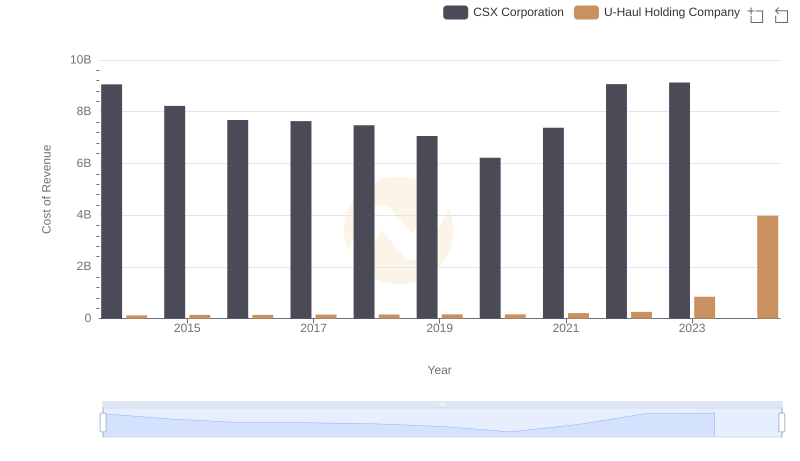
Cost Insights: Breaking Down CSX Corporation and U-Haul Holding Company's Expenses
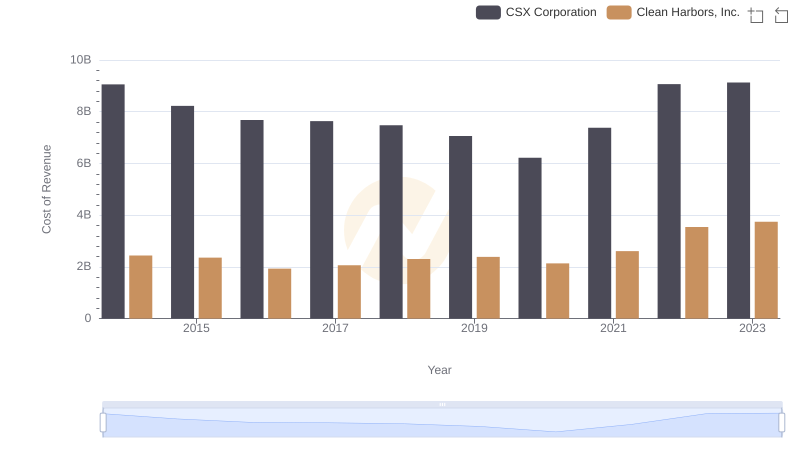
Cost of Revenue Comparison: CSX Corporation vs Clean Harbors, Inc.
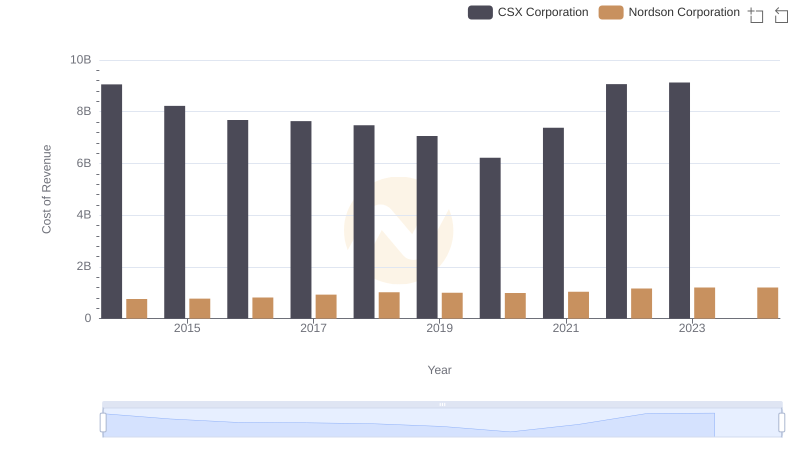
Cost Insights: Breaking Down CSX Corporation and Nordson Corporation's Expenses
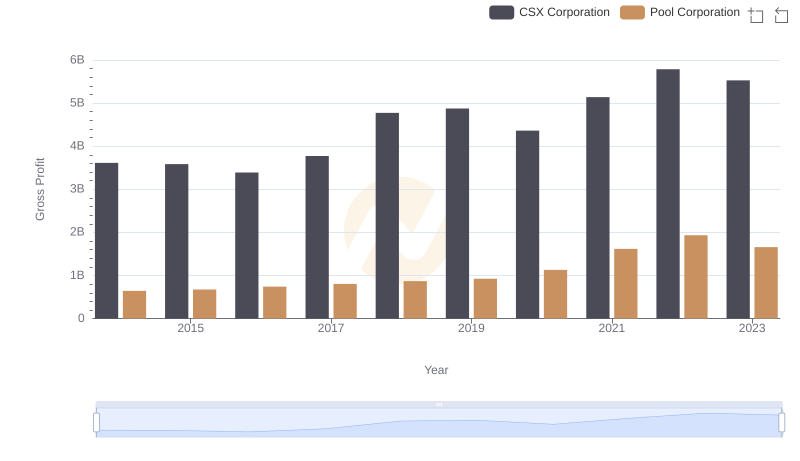
CSX Corporation vs Pool Corporation: A Gross Profit Performance Breakdown
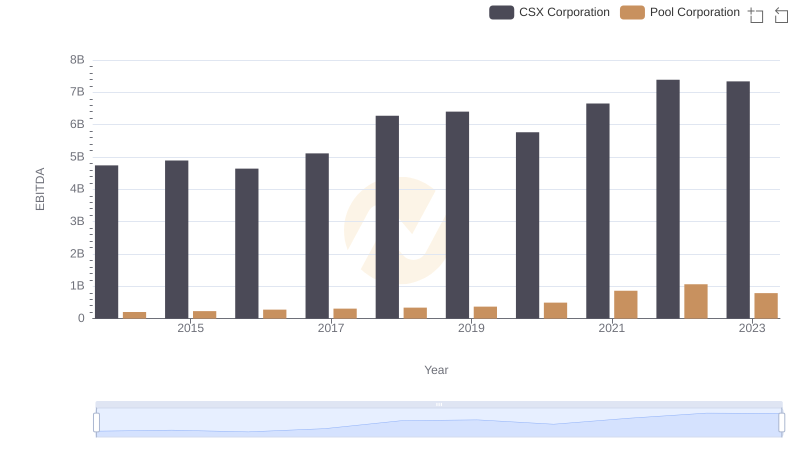
EBITDA Performance Review: CSX Corporation vs Pool Corporation