| __timestamp | AMETEK, Inc. | Clean Harbors, Inc. |
|---|---|---|
| Wednesday, January 1, 2014 | 1023344000 | 393092000 |
| Thursday, January 1, 2015 | 1093776000 | 461019000 |
| Friday, January 1, 2016 | 1007213000 | 380027000 |
| Sunday, January 1, 2017 | 1068174000 | 411975000 |
| Monday, January 1, 2018 | 1269415000 | 477159000 |
| Tuesday, January 1, 2019 | 1411422000 | 531861000 |
| Wednesday, January 1, 2020 | 1283159000 | 544047000 |
| Friday, January 1, 2021 | 1600782000 | 647725000 |
| Saturday, January 1, 2022 | 1820119000 | 1011488000 |
| Sunday, January 1, 2023 | 2025843000 | 989565000 |
| Monday, January 1, 2024 | 1779562000 | 799401000 |
Unleashing insights
In the ever-evolving landscape of industrial and environmental services, AMETEK, Inc. and Clean Harbors, Inc. have demonstrated remarkable EBITDA growth over the past decade. From 2014 to 2023, AMETEK's EBITDA surged by nearly 98%, reflecting its robust operational efficiency and strategic acquisitions. In contrast, Clean Harbors, Inc. experienced a commendable 152% increase, driven by its expanding environmental services portfolio.
This comparative analysis highlights the dynamic growth trajectories of these industry leaders, offering valuable insights for investors and stakeholders alike.
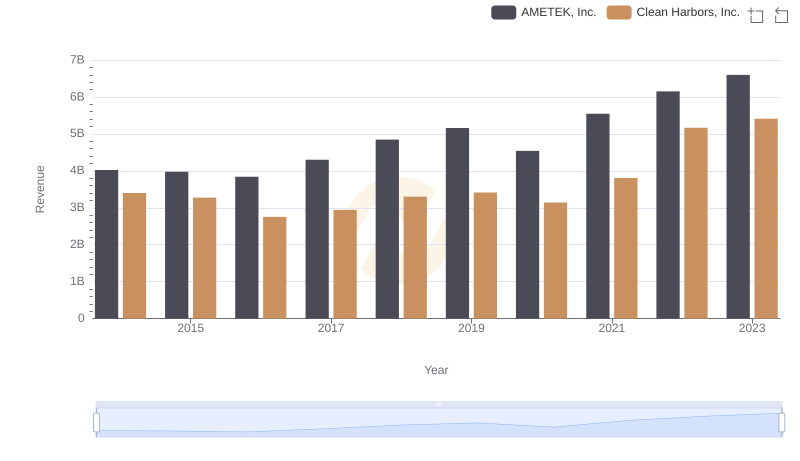
Revenue Showdown: AMETEK, Inc. vs Clean Harbors, Inc.
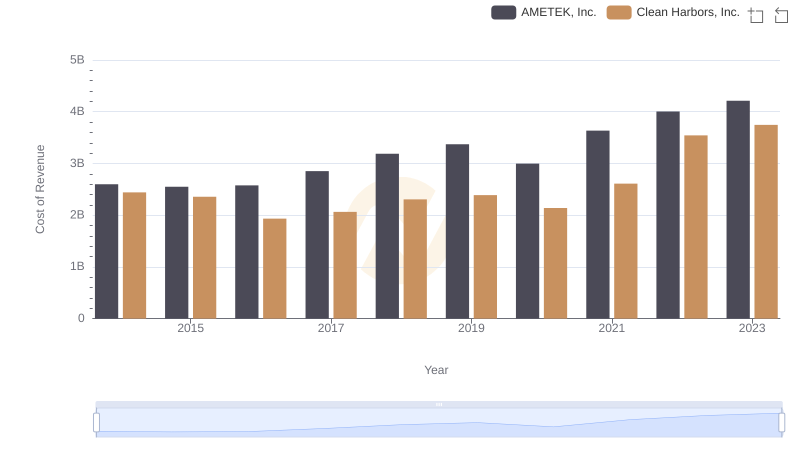
Analyzing Cost of Revenue: AMETEK, Inc. and Clean Harbors, Inc.
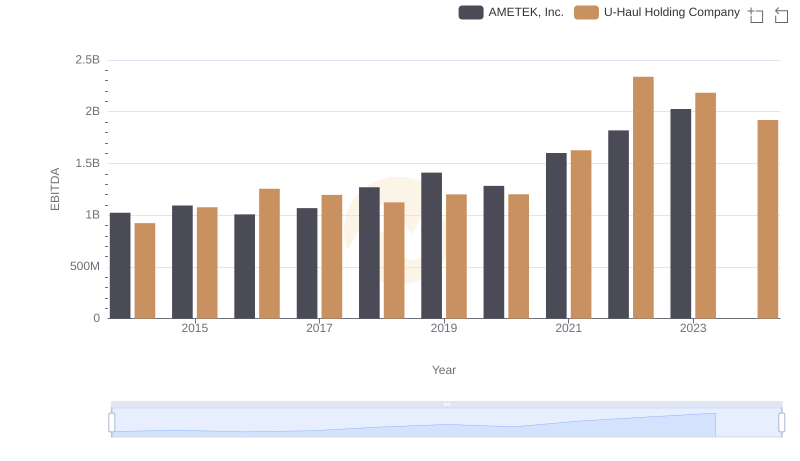
EBITDA Analysis: Evaluating AMETEK, Inc. Against U-Haul Holding Company
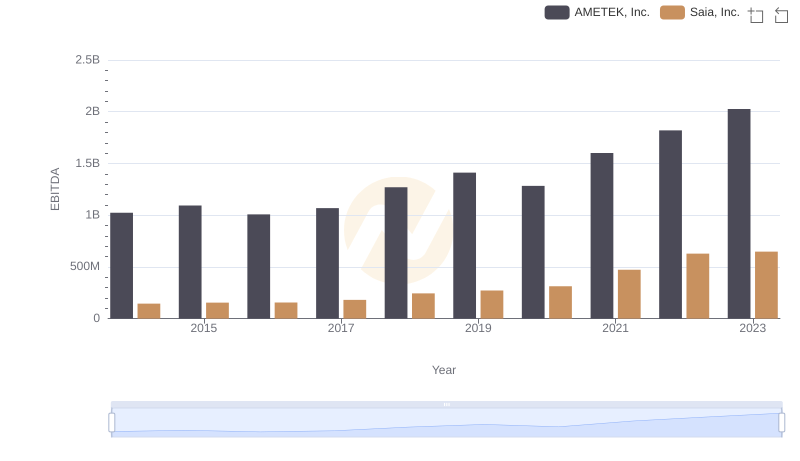
AMETEK, Inc. vs Saia, Inc.: In-Depth EBITDA Performance Comparison
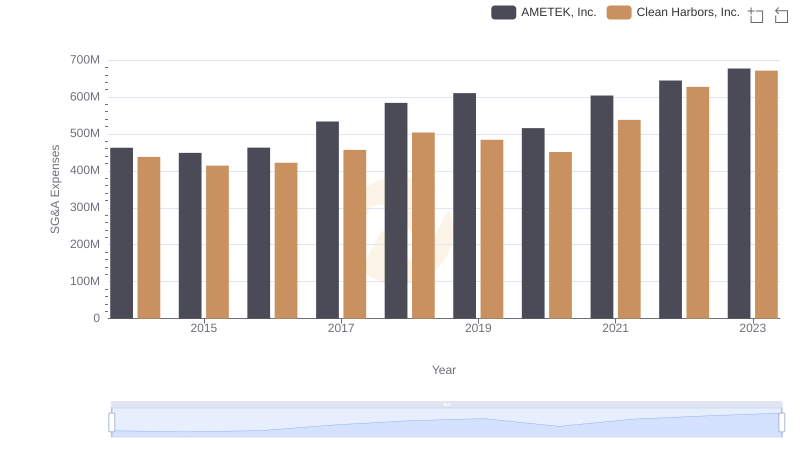
AMETEK, Inc. vs Clean Harbors, Inc.: SG&A Expense Trends
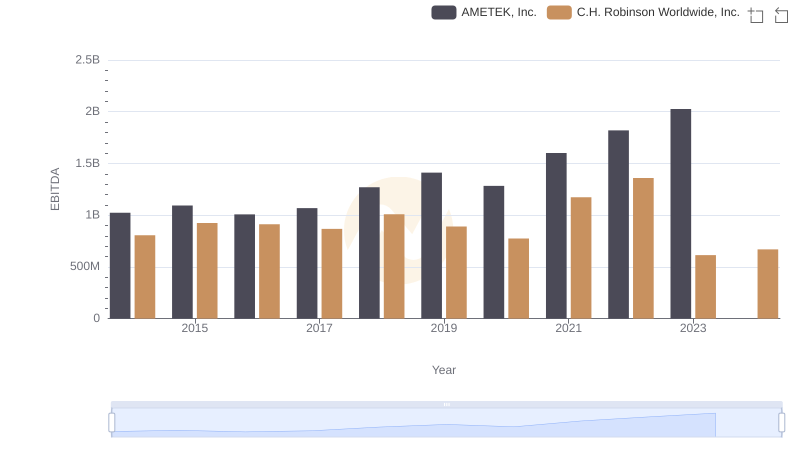
Professional EBITDA Benchmarking: AMETEK, Inc. vs C.H. Robinson Worldwide, Inc.
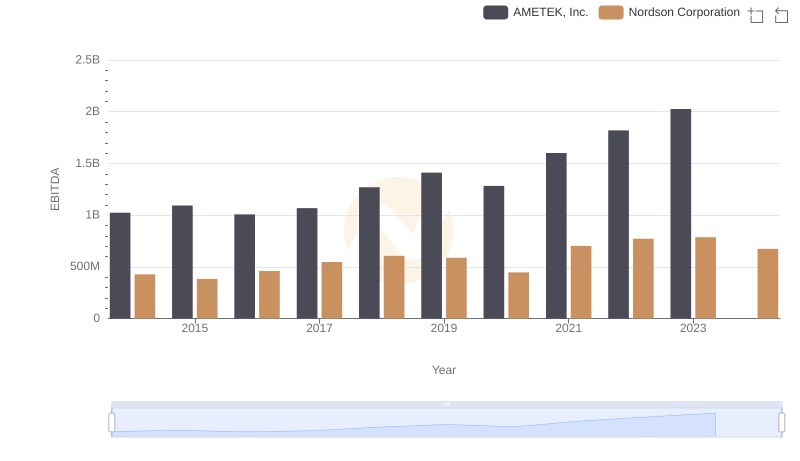
Comparative EBITDA Analysis: AMETEK, Inc. vs Nordson Corporation
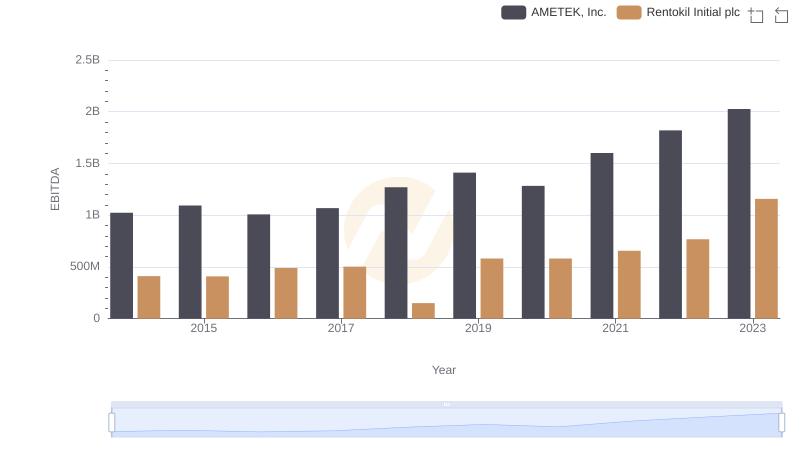
Comparative EBITDA Analysis: AMETEK, Inc. vs Rentokil Initial plc
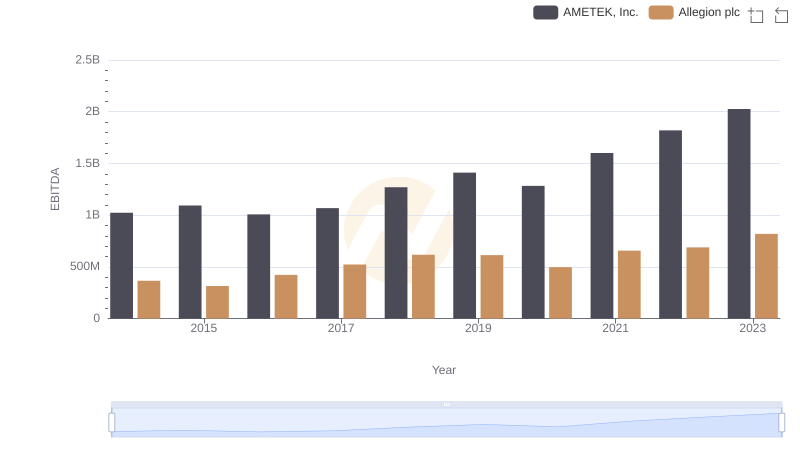
EBITDA Metrics Evaluated: AMETEK, Inc. vs Allegion plc
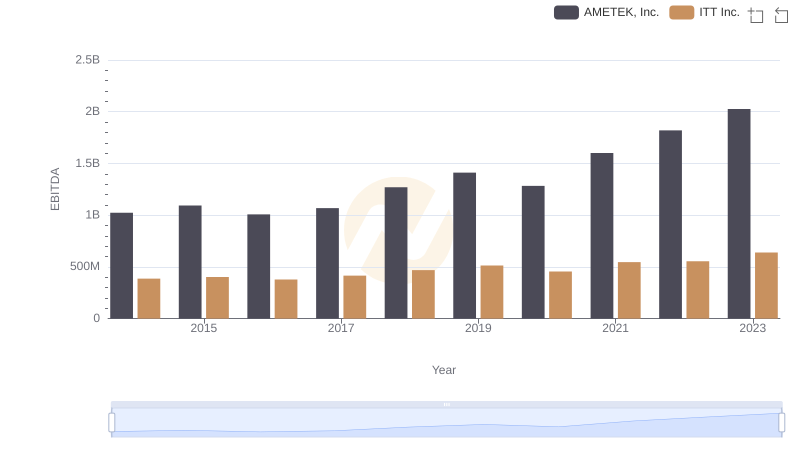
Comprehensive EBITDA Comparison: AMETEK, Inc. vs ITT Inc.