| __timestamp | AMETEK, Inc. | Clean Harbors, Inc. |
|---|---|---|
| Wednesday, January 1, 2014 | 4021964000 | 3401636000 |
| Thursday, January 1, 2015 | 3974295000 | 3275137000 |
| Friday, January 1, 2016 | 3840087000 | 2755226000 |
| Sunday, January 1, 2017 | 4300170000 | 2944978000 |
| Monday, January 1, 2018 | 4845872000 | 3300303000 |
| Tuesday, January 1, 2019 | 5158557000 | 3412190000 |
| Wednesday, January 1, 2020 | 4540029000 | 3144097000 |
| Friday, January 1, 2021 | 5546514000 | 3805566000 |
| Saturday, January 1, 2022 | 6150530000 | 5166605000 |
| Sunday, January 1, 2023 | 6596950000 | 5409152000 |
| Monday, January 1, 2024 | 6941180000 | 5889952000 |
Unlocking the unknown
In the ever-evolving landscape of industrial giants, AMETEK, Inc. and Clean Harbors, Inc. have been formidable players. Over the past decade, AMETEK has consistently outpaced Clean Harbors in revenue growth. From 2014 to 2023, AMETEK's revenue surged by approximately 64%, reaching a peak of $6.6 billion in 2023. In contrast, Clean Harbors experienced a 59% increase, culminating in $5.4 billion in the same year.
AMETEK's revenue trajectory showcases resilience, with a notable dip in 2016, followed by a robust recovery. Clean Harbors, while trailing, demonstrated a significant leap in 2022, narrowing the gap. This rivalry highlights the dynamic nature of the industrial sector, where strategic innovation and market adaptation are key.
As we look to the future, the question remains: will Clean Harbors close the gap, or will AMETEK continue to lead the charge?
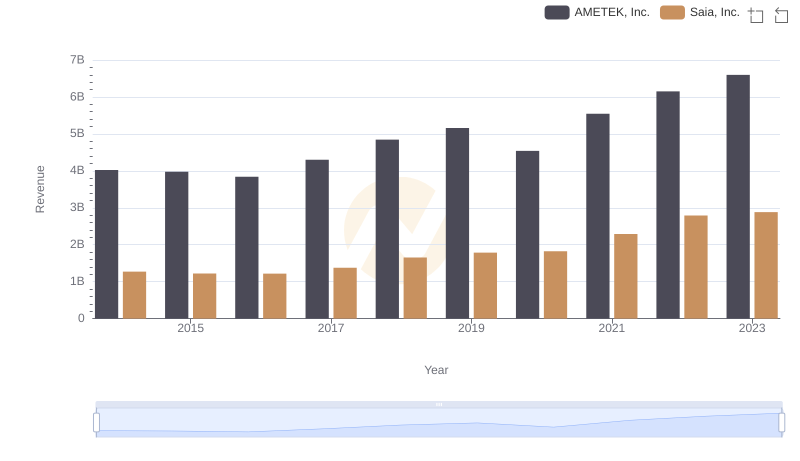
Revenue Showdown: AMETEK, Inc. vs Saia, Inc.
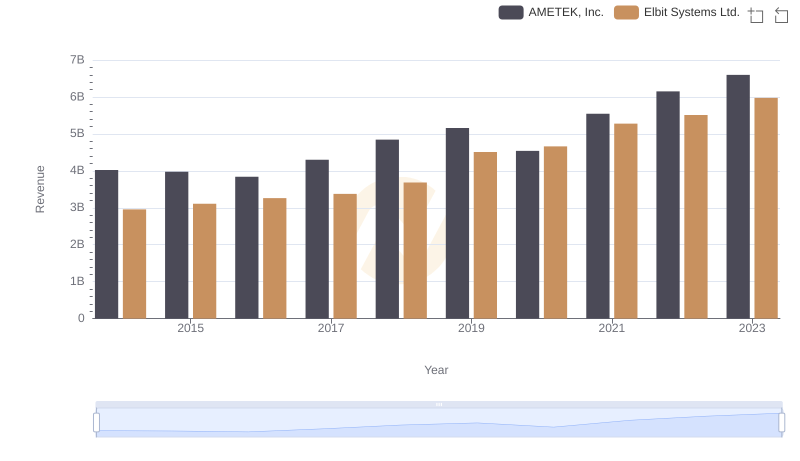
Revenue Insights: AMETEK, Inc. and Elbit Systems Ltd. Performance Compared
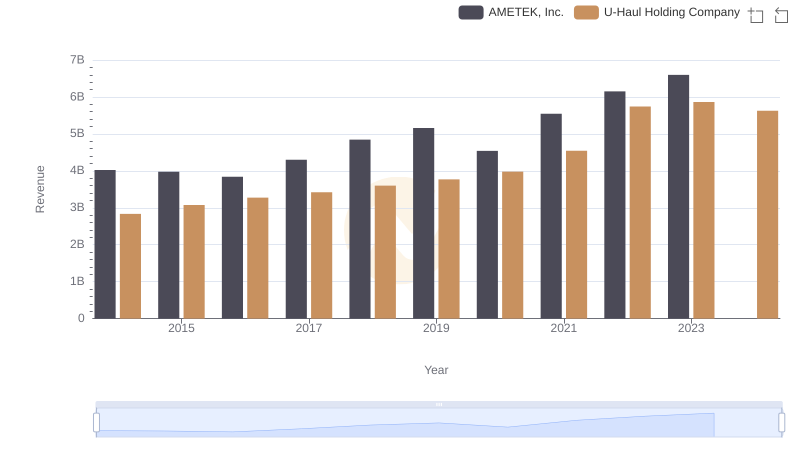
AMETEK, Inc. vs U-Haul Holding Company: Annual Revenue Growth Compared
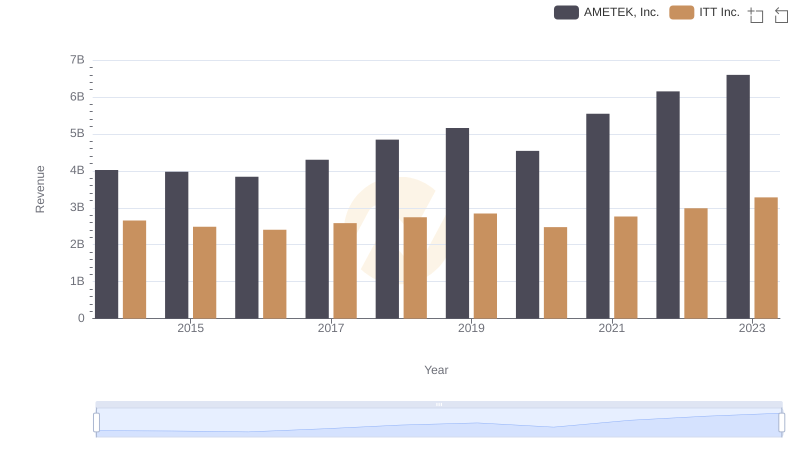
AMETEK, Inc. or ITT Inc.: Who Leads in Yearly Revenue?
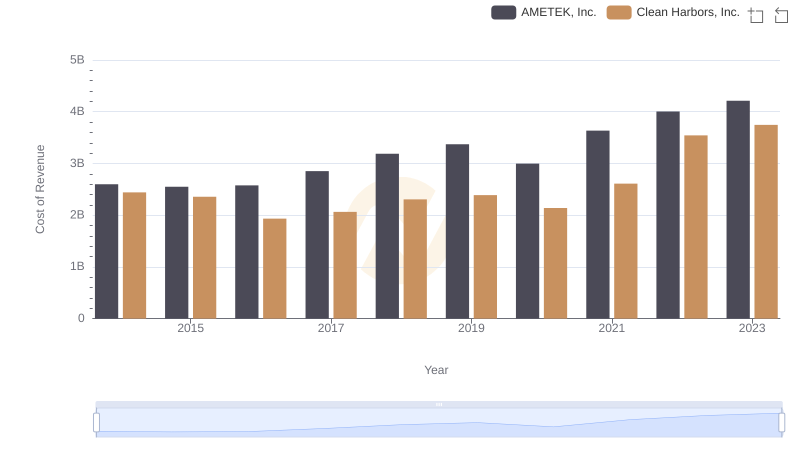
Analyzing Cost of Revenue: AMETEK, Inc. and Clean Harbors, Inc.
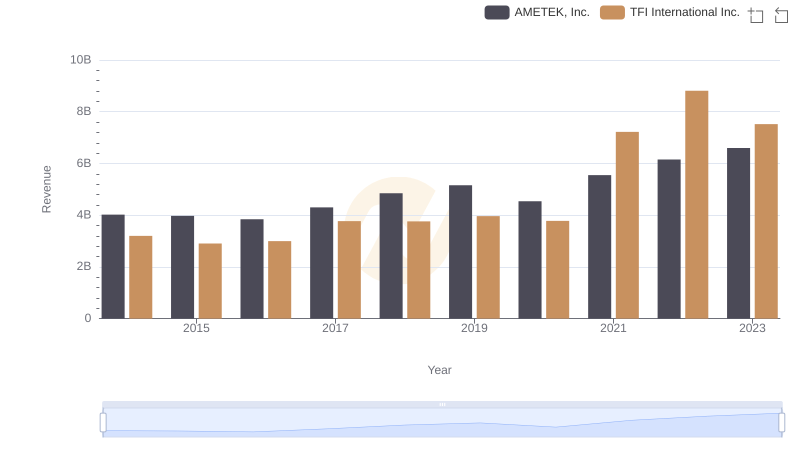
AMETEK, Inc. vs TFI International Inc.: Examining Key Revenue Metrics
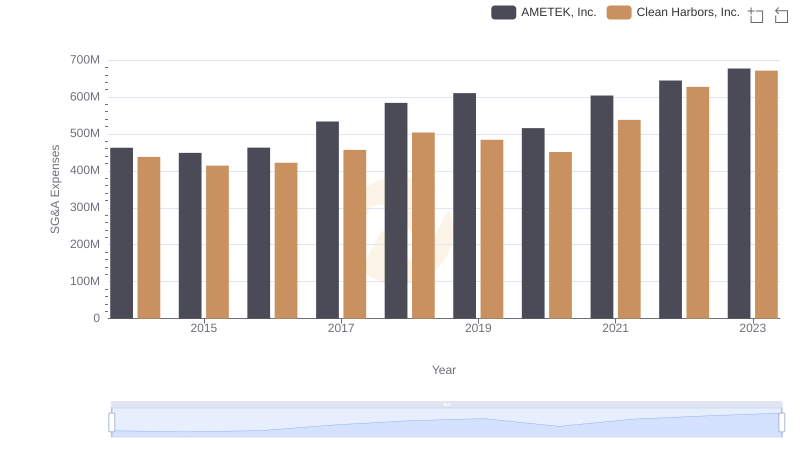
AMETEK, Inc. vs Clean Harbors, Inc.: SG&A Expense Trends
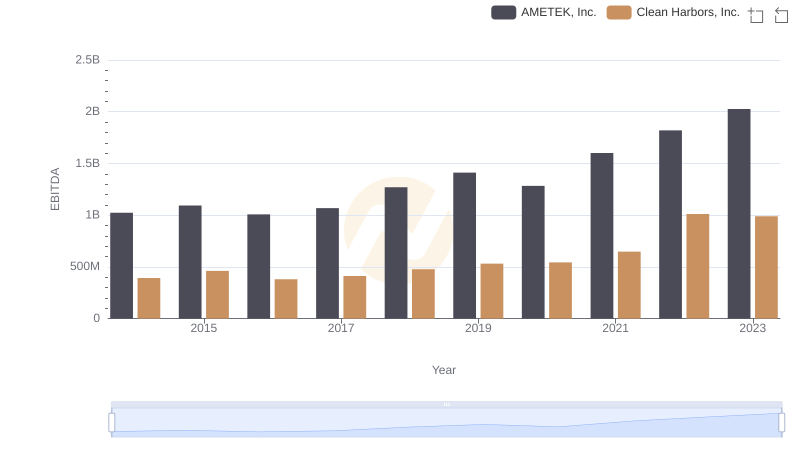
EBITDA Performance Review: AMETEK, Inc. vs Clean Harbors, Inc.