| __timestamp | AMETEK, Inc. | Allegion plc |
|---|---|---|
| Wednesday, January 1, 2014 | 1023344000 | 365700000 |
| Thursday, January 1, 2015 | 1093776000 | 315400000 |
| Friday, January 1, 2016 | 1007213000 | 422600000 |
| Sunday, January 1, 2017 | 1068174000 | 523300000 |
| Monday, January 1, 2018 | 1269415000 | 617600000 |
| Tuesday, January 1, 2019 | 1411422000 | 614300000 |
| Wednesday, January 1, 2020 | 1283159000 | 497700000 |
| Friday, January 1, 2021 | 1600782000 | 657300000 |
| Saturday, January 1, 2022 | 1820119000 | 688300000 |
| Sunday, January 1, 2023 | 2025843000 | 819300000 |
| Monday, January 1, 2024 | 1779562000 | 919800000 |
Cracking the code
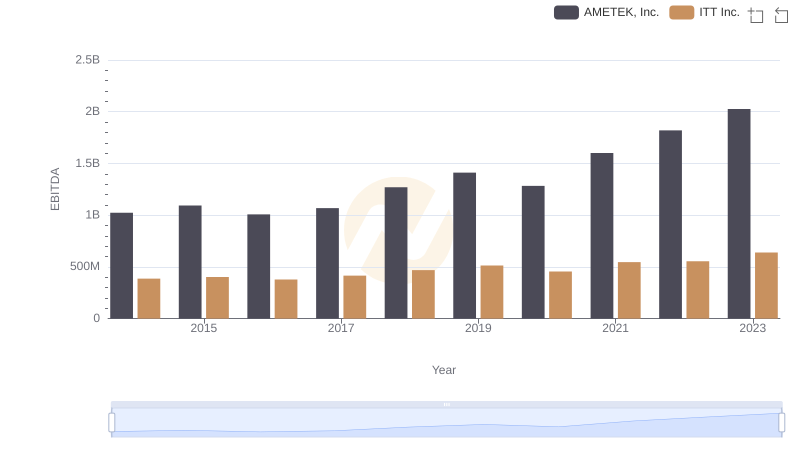
In the competitive landscape of industrial technology, AMETEK, Inc. and Allegion plc have showcased remarkable EBITDA growth over the past decade. From 2014 to 2023, AMETEK, Inc. has consistently outperformed Allegion plc, with its EBITDA growing by approximately 98%, reaching a peak in 2023. This growth trajectory highlights AMETEK's strategic focus on innovation and operational efficiency.
Conversely, Allegion plc, while trailing behind, has demonstrated a steady increase of around 124% in EBITDA over the same period. This growth underscores Allegion's commitment to expanding its market presence and enhancing its product offerings.
The data reveals a compelling narrative of resilience and strategic foresight, with both companies navigating economic fluctuations and industry challenges. As we look to the future, these trends offer valuable insights into the evolving dynamics of the industrial sector.
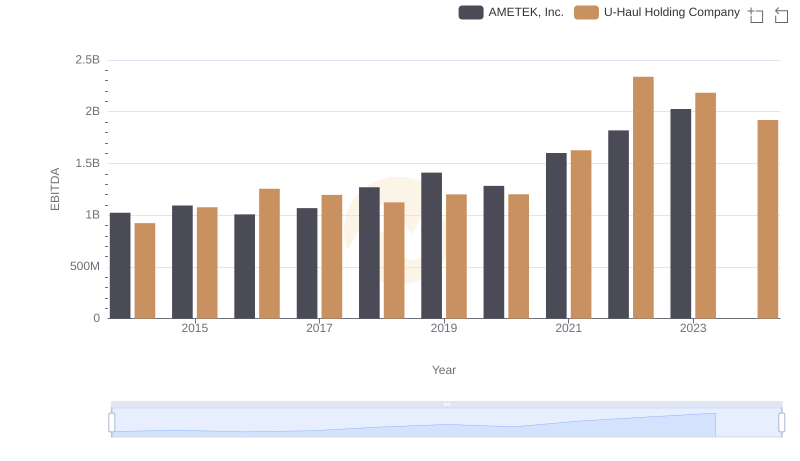
EBITDA Analysis: Evaluating AMETEK, Inc. Against U-Haul Holding Company
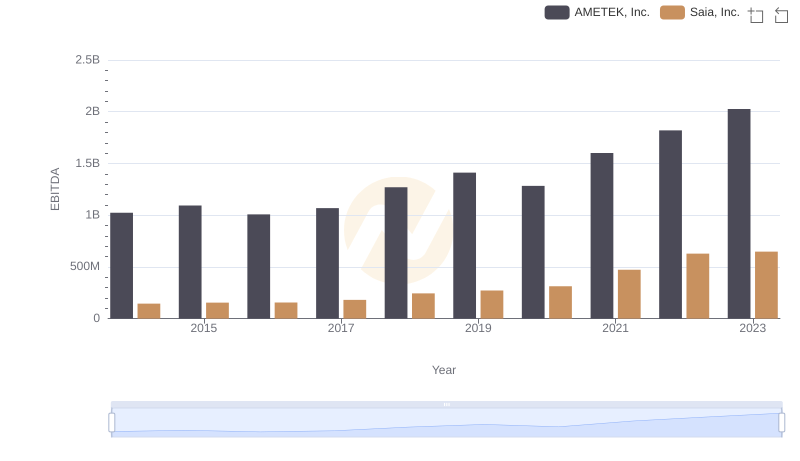
AMETEK, Inc. vs Saia, Inc.: In-Depth EBITDA Performance Comparison
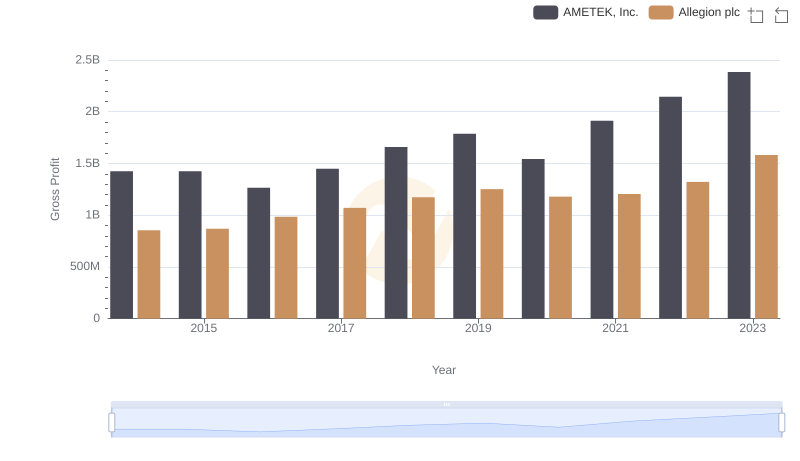
AMETEK, Inc. vs Allegion plc: A Gross Profit Performance Breakdown
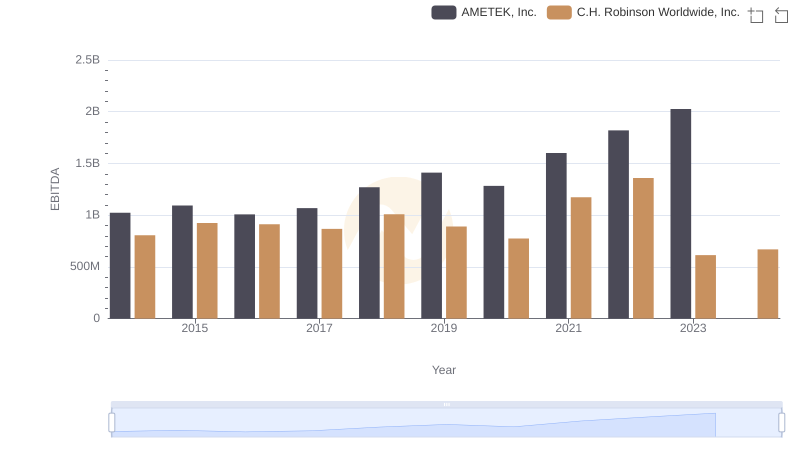
Professional EBITDA Benchmarking: AMETEK, Inc. vs C.H. Robinson Worldwide, Inc.
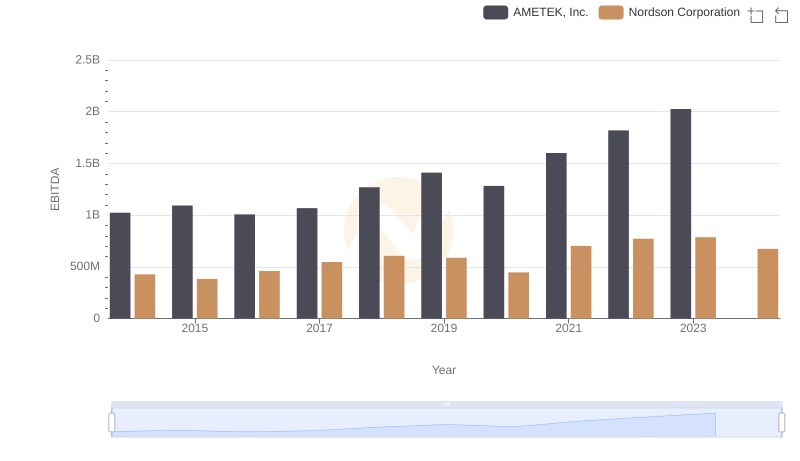
Comparative EBITDA Analysis: AMETEK, Inc. vs Nordson Corporation
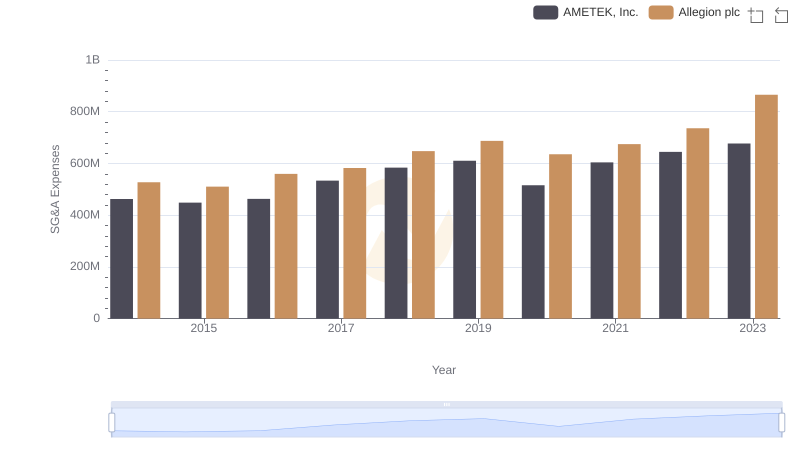
Comparing SG&A Expenses: AMETEK, Inc. vs Allegion plc Trends and Insights
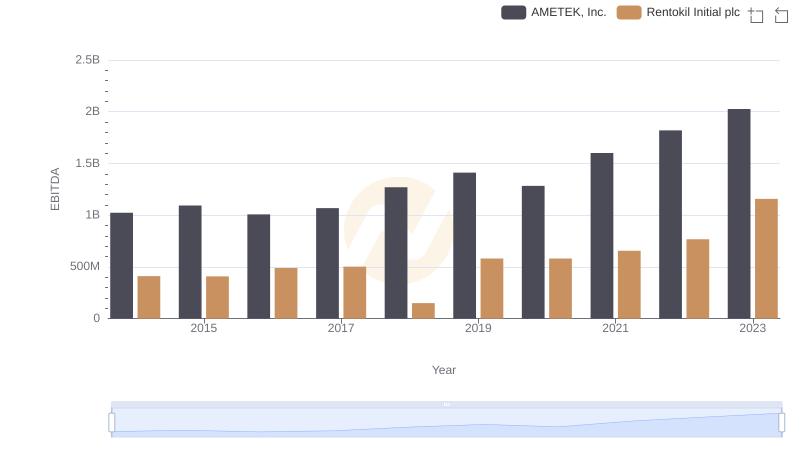
Comparative EBITDA Analysis: AMETEK, Inc. vs Rentokil Initial plc
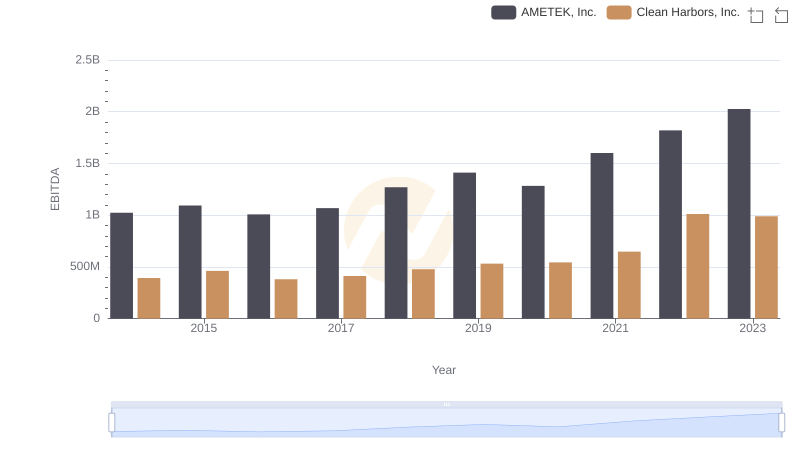
EBITDA Performance Review: AMETEK, Inc. vs Clean Harbors, Inc.
Comprehensive EBITDA Comparison: AMETEK, Inc. vs ITT Inc.