| __timestamp | AMETEK, Inc. | U-Haul Holding Company |
|---|---|---|
| Wednesday, January 1, 2014 | 1023344000 | 923383000 |
| Thursday, January 1, 2015 | 1093776000 | 1076520000 |
| Friday, January 1, 2016 | 1007213000 | 1255474000 |
| Sunday, January 1, 2017 | 1068174000 | 1195593000 |
| Monday, January 1, 2018 | 1269415000 | 1123974000 |
| Tuesday, January 1, 2019 | 1411422000 | 1200955000 |
| Wednesday, January 1, 2020 | 1283159000 | 1202436000 |
| Friday, January 1, 2021 | 1600782000 | 1627442000 |
| Saturday, January 1, 2022 | 1820119000 | 2337788000 |
| Sunday, January 1, 2023 | 2025843000 | 2183839000 |
| Monday, January 1, 2024 | 1779562000 | 1919656000 |
Igniting the spark of knowledge
In the ever-evolving landscape of American industry, AMETEK, Inc. and U-Haul Holding Company stand as titans in their respective fields. Over the past decade, these companies have demonstrated remarkable financial resilience, as evidenced by their EBITDA performance from 2014 to 2023.
AMETEK, Inc., a leader in electronic instruments and electromechanical devices, has seen its EBITDA grow by approximately 98% from 2014 to 2023. Meanwhile, U-Haul, a household name in moving and storage, experienced a staggering 137% increase in EBITDA over the same period. Notably, U-Haul's EBITDA surpassed AMETEK's in 2022, marking a significant shift in financial dynamics.
While AMETEK's data for 2024 is missing, U-Haul's projected EBITDA for that year suggests a potential decline, highlighting the volatility and unpredictability of market conditions. This analysis underscores the importance of strategic adaptability in maintaining financial growth.
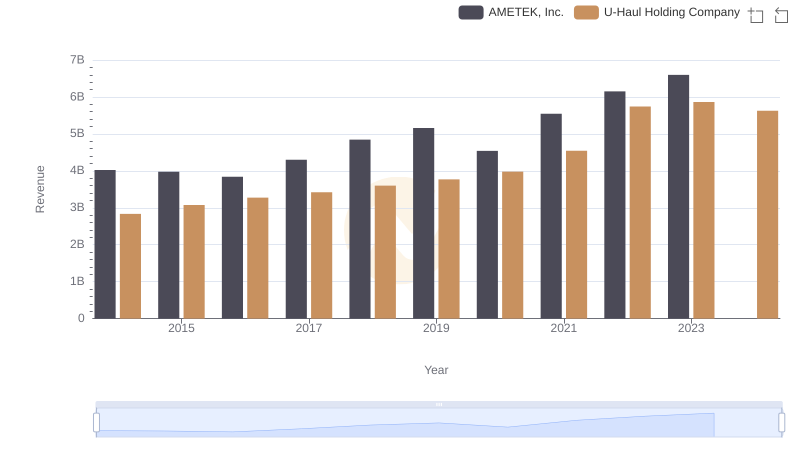
AMETEK, Inc. vs U-Haul Holding Company: Annual Revenue Growth Compared
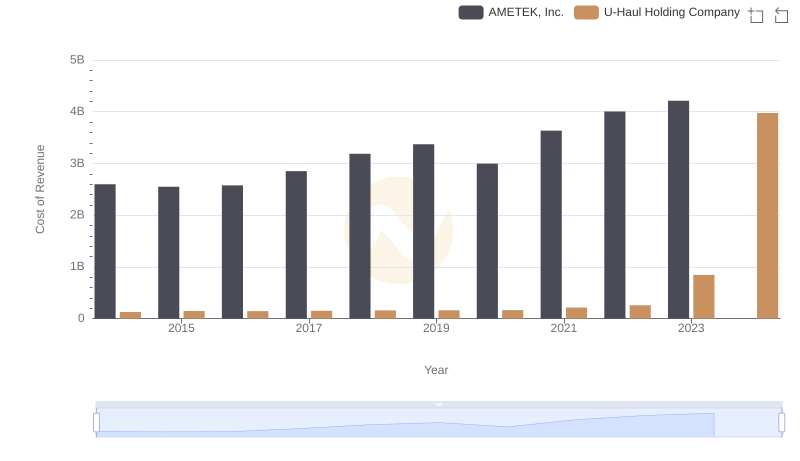
Comparing Cost of Revenue Efficiency: AMETEK, Inc. vs U-Haul Holding Company
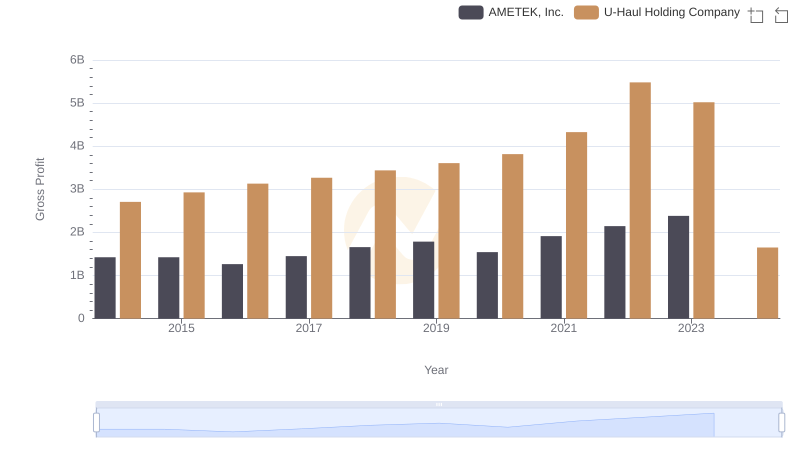
AMETEK, Inc. vs U-Haul Holding Company: A Gross Profit Performance Breakdown
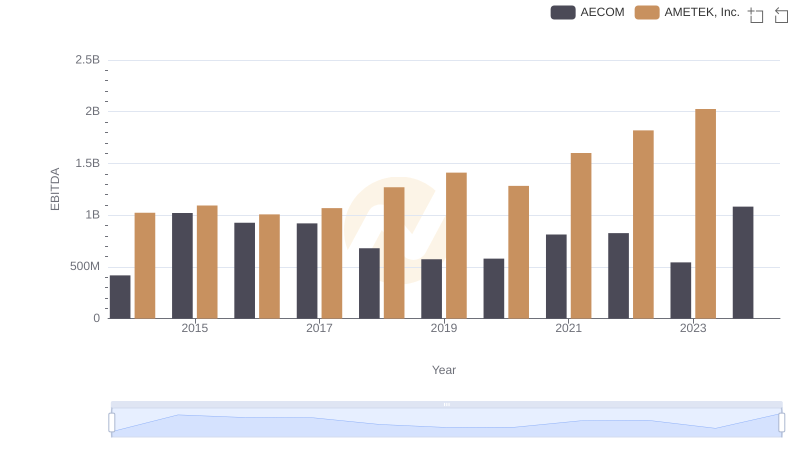
AMETEK, Inc. and AECOM: A Detailed Examination of EBITDA Performance
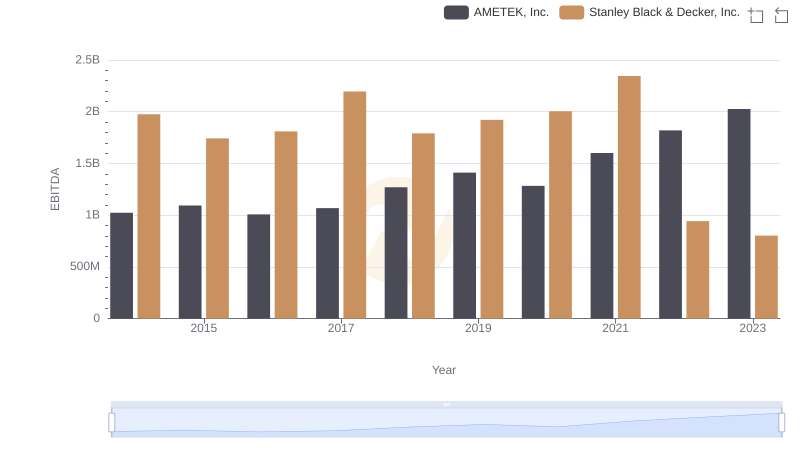
Professional EBITDA Benchmarking: AMETEK, Inc. vs Stanley Black & Decker, Inc.
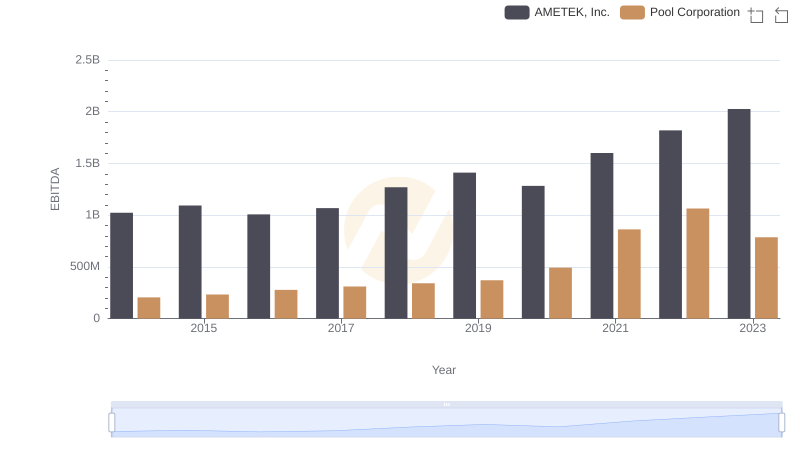
Professional EBITDA Benchmarking: AMETEK, Inc. vs Pool Corporation
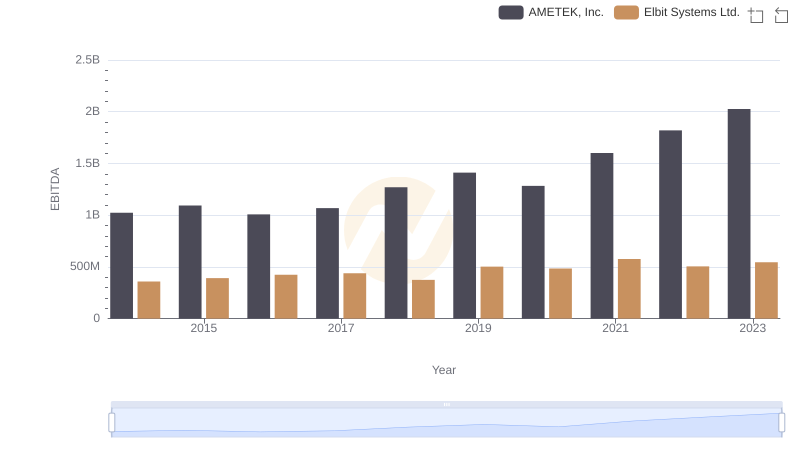
EBITDA Metrics Evaluated: AMETEK, Inc. vs Elbit Systems Ltd.
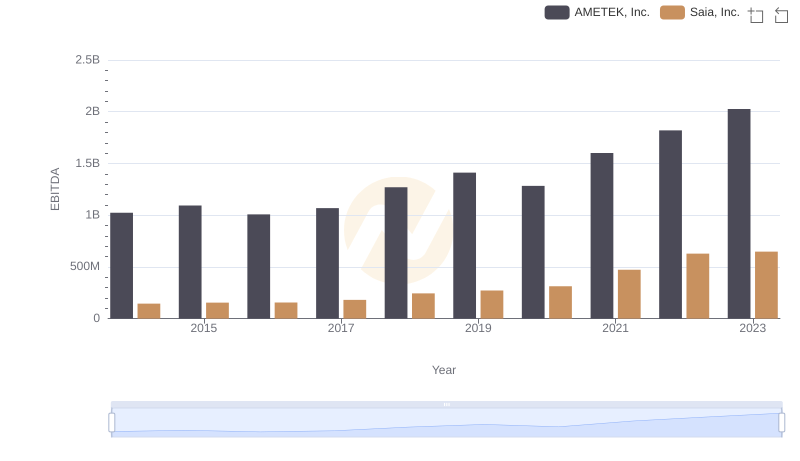
AMETEK, Inc. vs Saia, Inc.: In-Depth EBITDA Performance Comparison
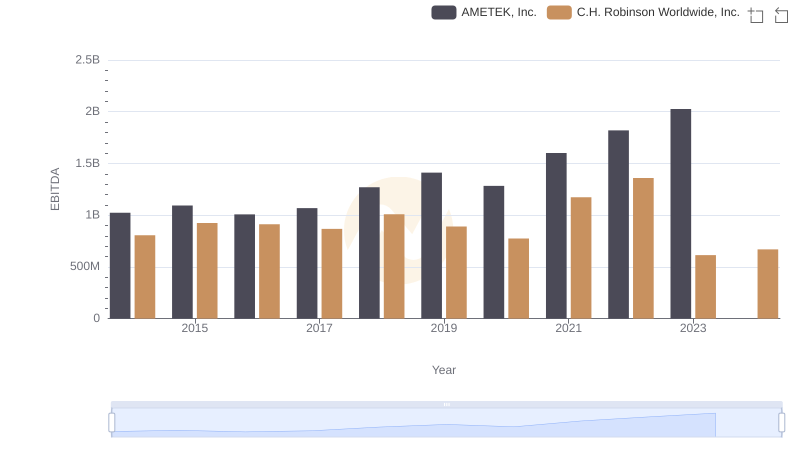
Professional EBITDA Benchmarking: AMETEK, Inc. vs C.H. Robinson Worldwide, Inc.
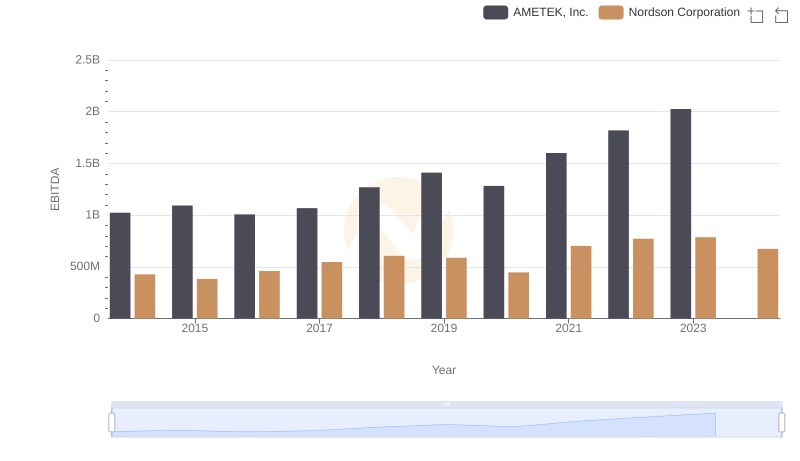
Comparative EBITDA Analysis: AMETEK, Inc. vs Nordson Corporation