| __timestamp | AMETEK, Inc. | Nordson Corporation |
|---|---|---|
| Wednesday, January 1, 2014 | 1023344000 | 427302000 |
| Thursday, January 1, 2015 | 1093776000 | 384160000 |
| Friday, January 1, 2016 | 1007213000 | 460120000 |
| Sunday, January 1, 2017 | 1068174000 | 547746000 |
| Monday, January 1, 2018 | 1269415000 | 606502000 |
| Tuesday, January 1, 2019 | 1411422000 | 588493000 |
| Wednesday, January 1, 2020 | 1283159000 | 446951000 |
| Friday, January 1, 2021 | 1600782000 | 703550000 |
| Saturday, January 1, 2022 | 1820119000 | 771615000 |
| Sunday, January 1, 2023 | 2025843000 | 786742000 |
| Monday, January 1, 2024 | 1779562000 | 674001000 |
Igniting the spark of knowledge
In the competitive landscape of industrial manufacturing, AMETEK, Inc. and Nordson Corporation have showcased remarkable financial resilience over the past decade. From 2014 to 2023, AMETEK's EBITDA surged by approximately 98%, reflecting its strategic expansions and operational efficiencies. In contrast, Nordson Corporation experienced a steady growth of around 84% in the same period, underscoring its robust market presence and innovation-driven approach.
AMETEK's EBITDA growth trajectory peaked in 2023, reaching its highest point, while Nordson's consistent performance highlights its adaptability in a dynamic market. Notably, 2024 data for AMETEK is missing, leaving room for speculation on its future performance. This comparative analysis not only highlights the financial prowess of these industrial giants but also offers insights into their strategic directions in the ever-evolving manufacturing sector.
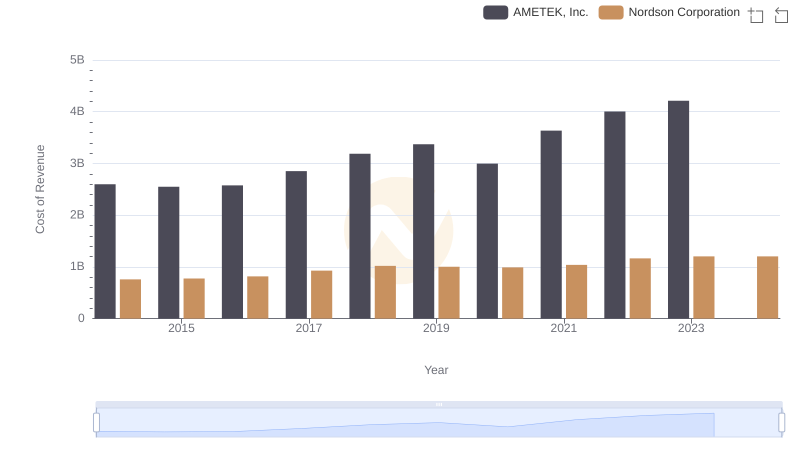
Analyzing Cost of Revenue: AMETEK, Inc. and Nordson Corporation
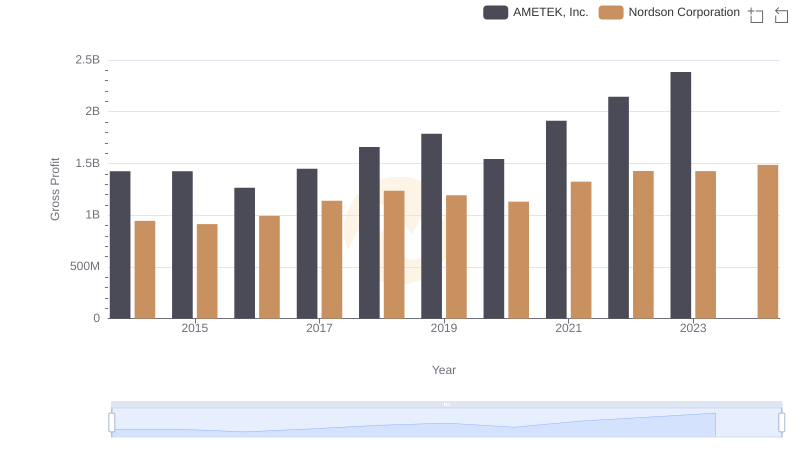
AMETEK, Inc. vs Nordson Corporation: A Gross Profit Performance Breakdown
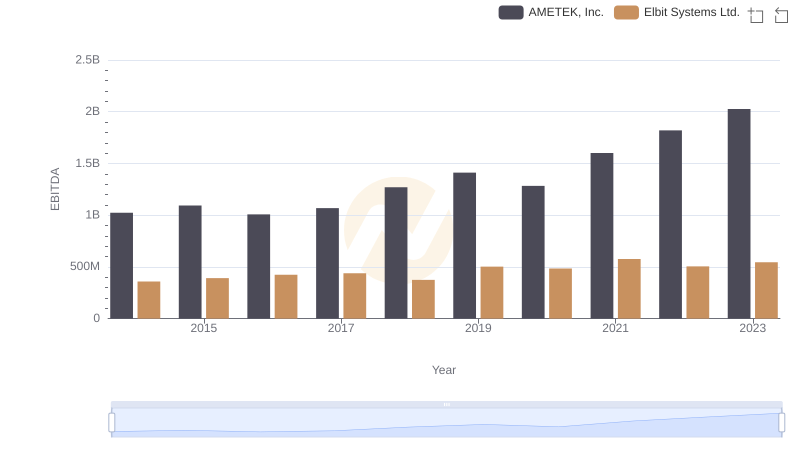
EBITDA Metrics Evaluated: AMETEK, Inc. vs Elbit Systems Ltd.
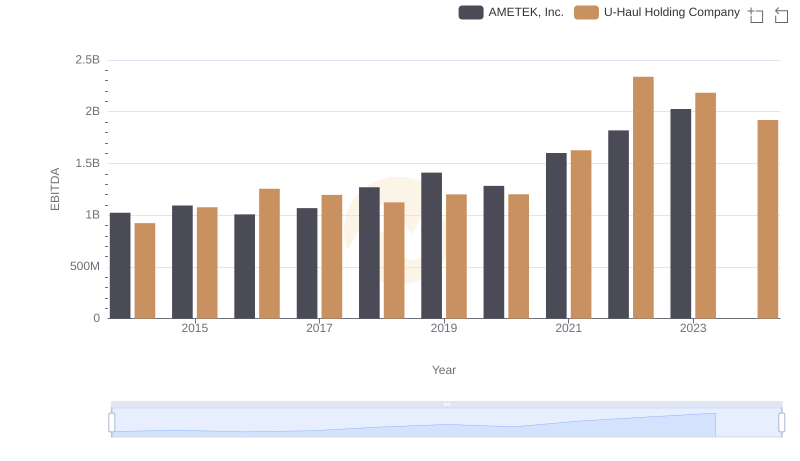
EBITDA Analysis: Evaluating AMETEK, Inc. Against U-Haul Holding Company
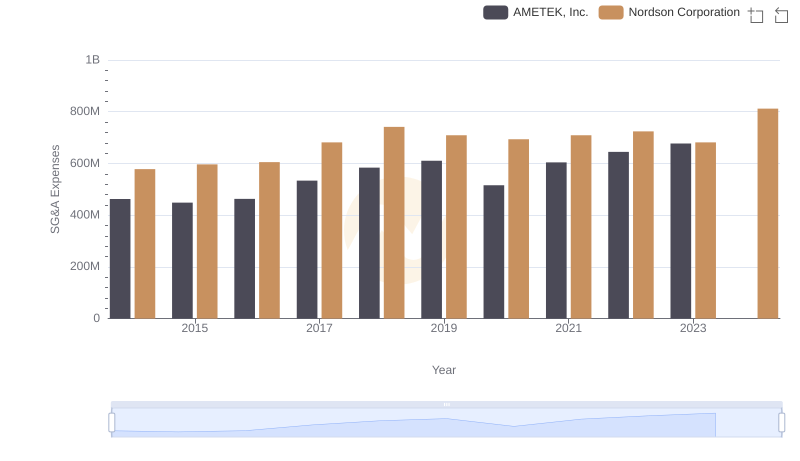
AMETEK, Inc. vs Nordson Corporation: SG&A Expense Trends
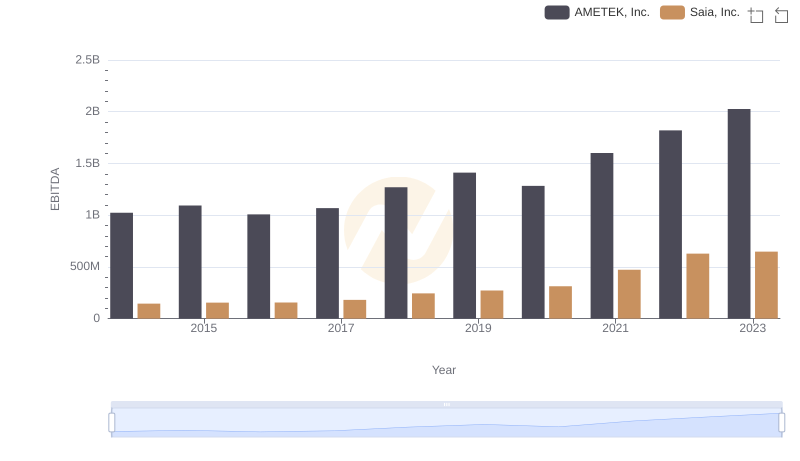
AMETEK, Inc. vs Saia, Inc.: In-Depth EBITDA Performance Comparison
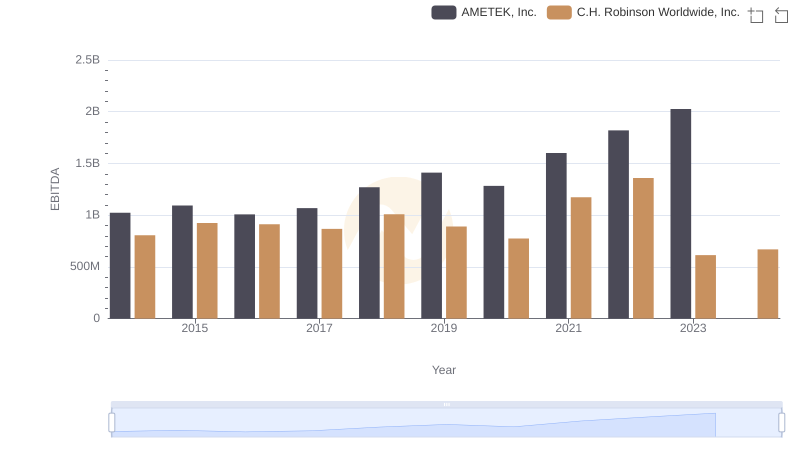
Professional EBITDA Benchmarking: AMETEK, Inc. vs C.H. Robinson Worldwide, Inc.
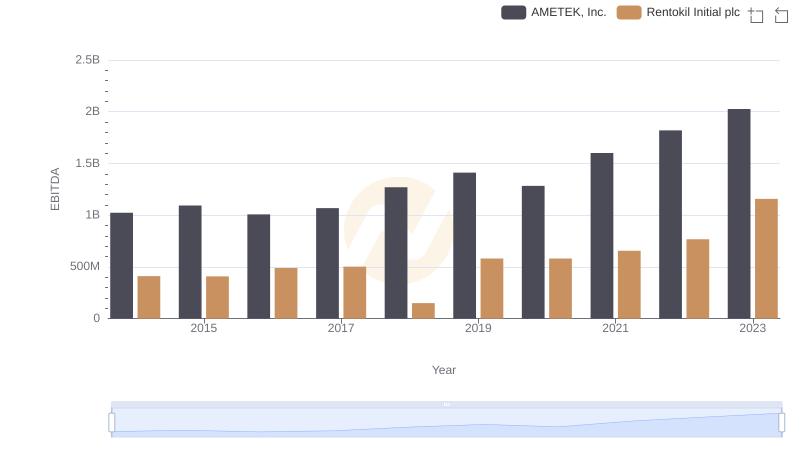
Comparative EBITDA Analysis: AMETEK, Inc. vs Rentokil Initial plc
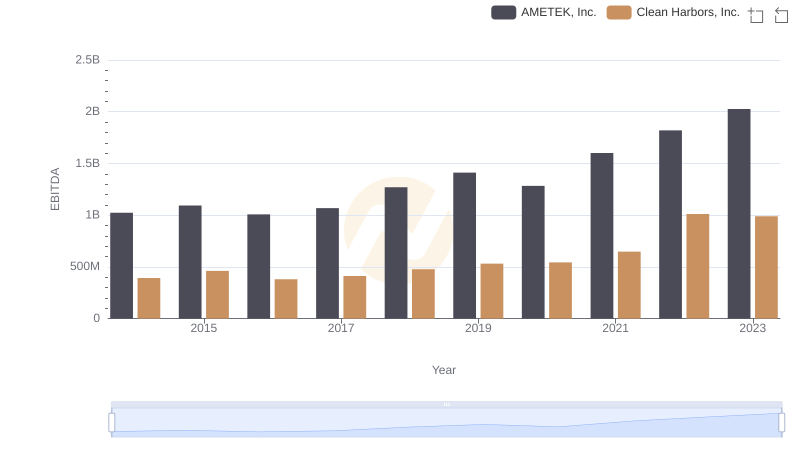
EBITDA Performance Review: AMETEK, Inc. vs Clean Harbors, Inc.
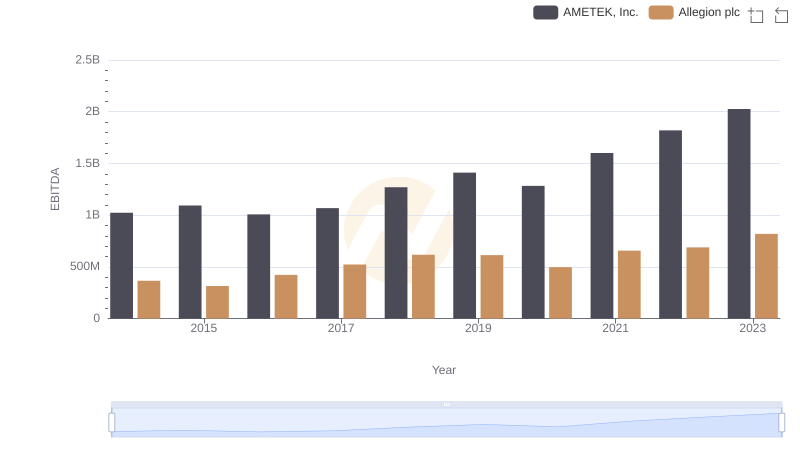
EBITDA Metrics Evaluated: AMETEK, Inc. vs Allegion plc