| __timestamp | AMETEK, Inc. | Clean Harbors, Inc. |
|---|---|---|
| Wednesday, January 1, 2014 | 2597017000 | 2441796000 |
| Thursday, January 1, 2015 | 2549280000 | 2356806000 |
| Friday, January 1, 2016 | 2575220000 | 1932857000 |
| Sunday, January 1, 2017 | 2851431000 | 2062673000 |
| Monday, January 1, 2018 | 3186310000 | 2305551000 |
| Tuesday, January 1, 2019 | 3370897000 | 2387819000 |
| Wednesday, January 1, 2020 | 2996515000 | 2137751000 |
| Friday, January 1, 2021 | 3633900000 | 2609837000 |
| Saturday, January 1, 2022 | 4005261000 | 3543930000 |
| Sunday, January 1, 2023 | 4212484999 | 3746124000 |
| Monday, January 1, 2024 | 0 | 4065713000 |
Cracking the code
In the ever-evolving landscape of industrial and environmental services, AMETEK, Inc. and Clean Harbors, Inc. have shown remarkable trends in their cost of revenue over the past decade. From 2014 to 2023, AMETEK's cost of revenue surged by approximately 62%, reflecting its strategic expansions and operational efficiencies. Meanwhile, Clean Harbors experienced a 53% increase, underscoring its robust growth in environmental services.
Starting in 2014, AMETEK's cost of revenue was slightly above Clean Harbors, but by 2023, both companies had significantly increased their expenditures, with AMETEK leading by a margin of around 12%. This trend highlights the competitive nature of the industry and the companies' commitment to scaling their operations.
As both companies continue to innovate and expand, monitoring their cost of revenue will provide valuable insights into their financial health and market strategies.
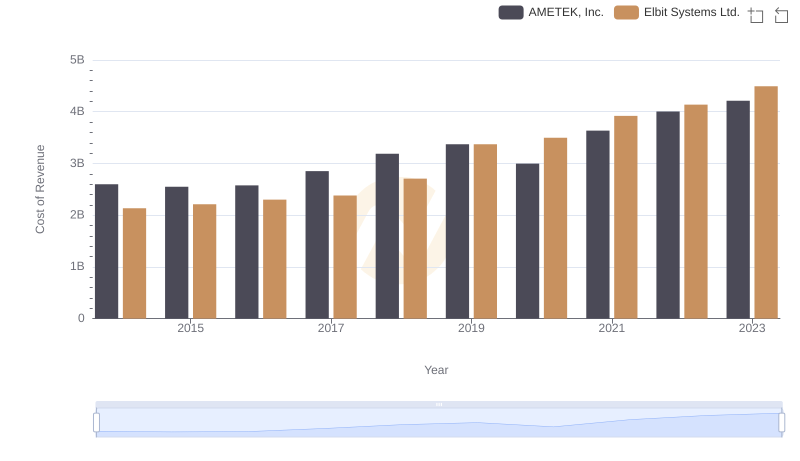
Cost of Revenue Comparison: AMETEK, Inc. vs Elbit Systems Ltd.
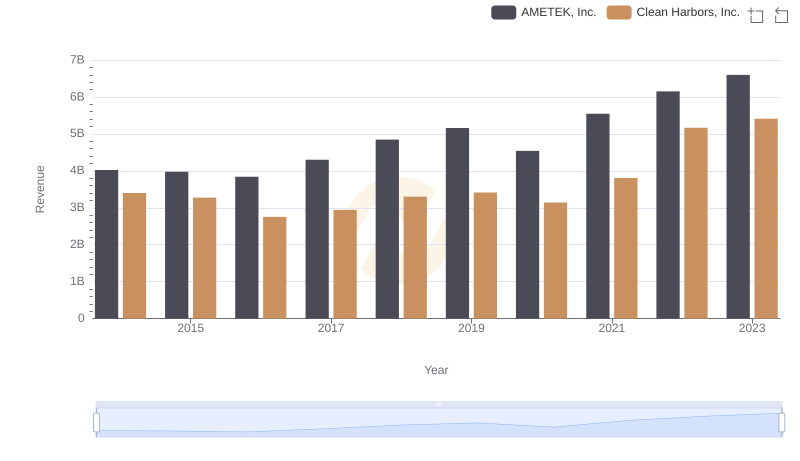
Revenue Showdown: AMETEK, Inc. vs Clean Harbors, Inc.
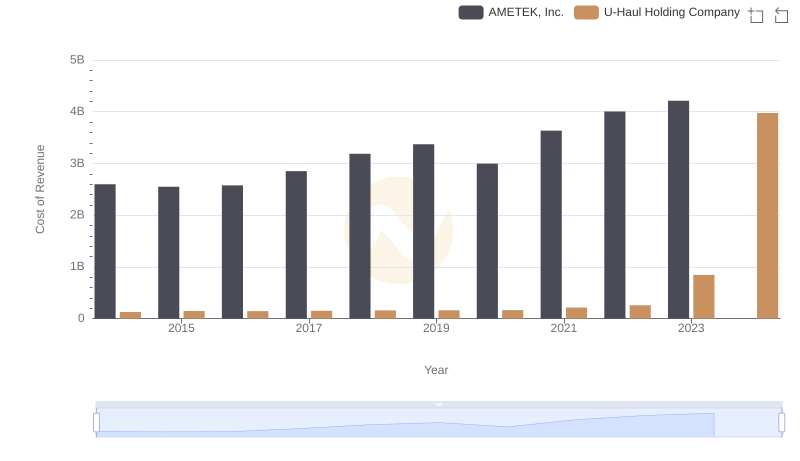
Comparing Cost of Revenue Efficiency: AMETEK, Inc. vs U-Haul Holding Company
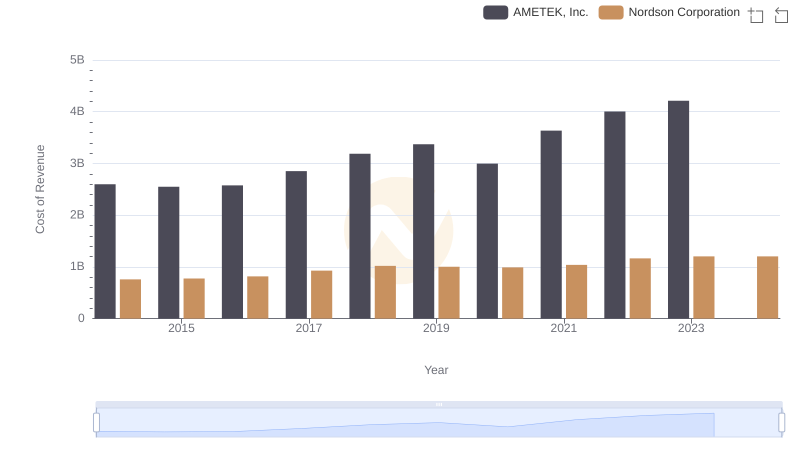
Analyzing Cost of Revenue: AMETEK, Inc. and Nordson Corporation
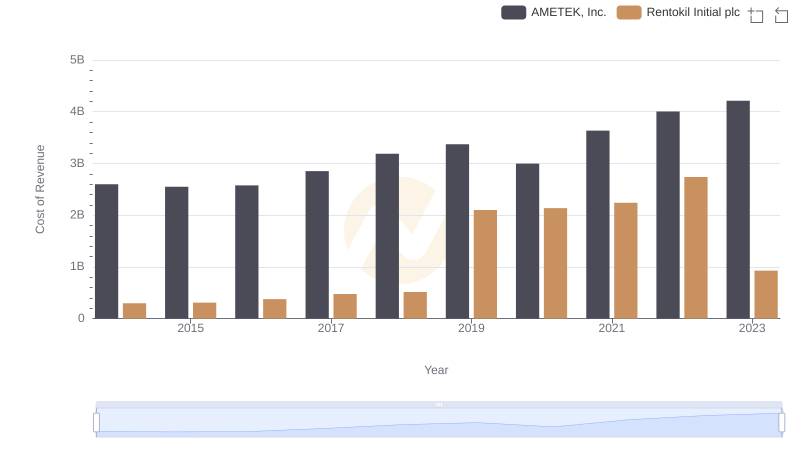
Cost Insights: Breaking Down AMETEK, Inc. and Rentokil Initial plc's Expenses
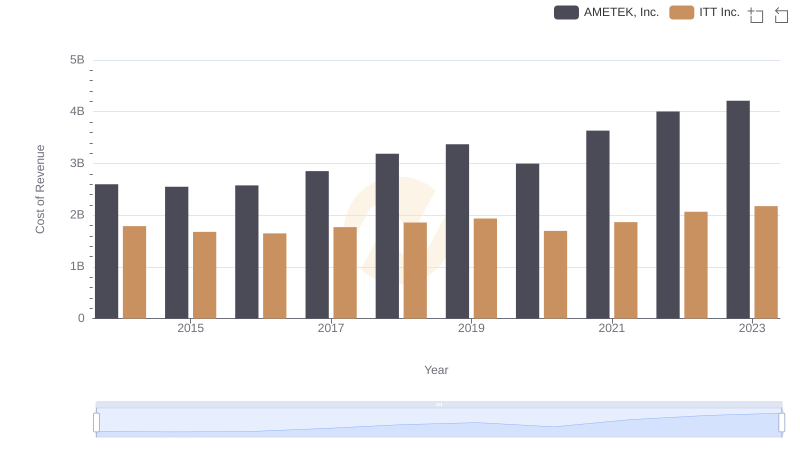
Cost of Revenue Trends: AMETEK, Inc. vs ITT Inc.
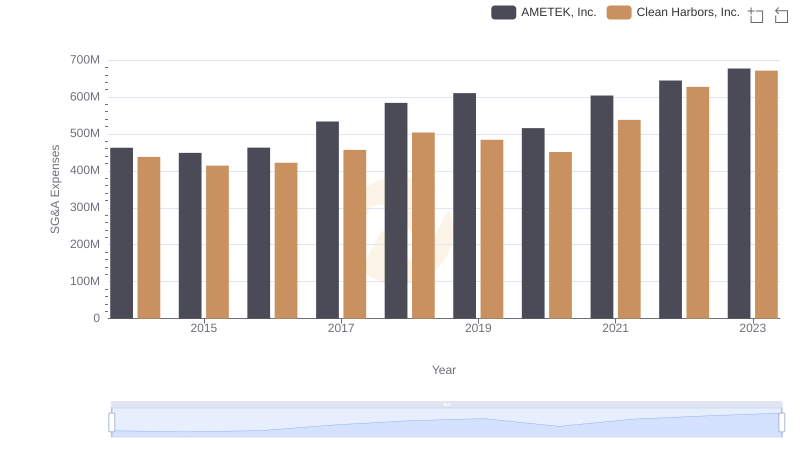
AMETEK, Inc. vs Clean Harbors, Inc.: SG&A Expense Trends
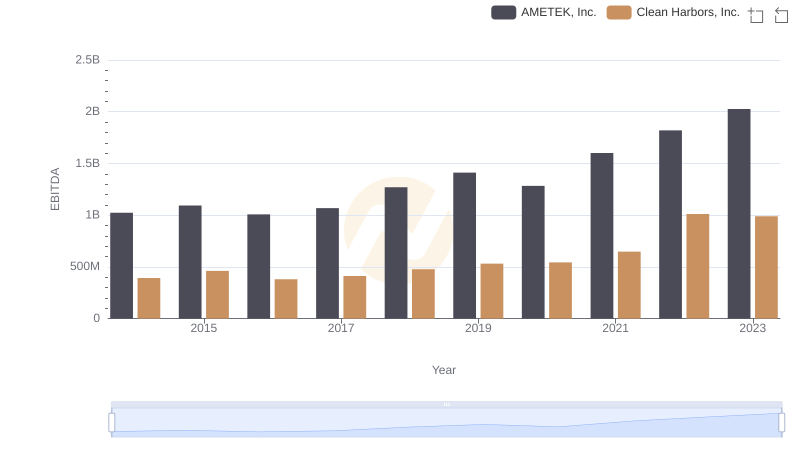
EBITDA Performance Review: AMETEK, Inc. vs Clean Harbors, Inc.