| __timestamp | Old Dominion Freight Line, Inc. | Textron Inc. |
|---|---|---|
| Wednesday, January 1, 2014 | 585590000 | 1575000000 |
| Thursday, January 1, 2015 | 660570000 | 1601000000 |
| Friday, January 1, 2016 | 671786000 | 1484000000 |
| Sunday, January 1, 2017 | 783749000 | 1367000000 |
| Monday, January 1, 2018 | 1046059000 | 1974000000 |
| Tuesday, January 1, 2019 | 1078007000 | 1518000000 |
| Wednesday, January 1, 2020 | 1168149000 | 827000000 |
| Friday, January 1, 2021 | 1651501000 | 1391000000 |
| Saturday, January 1, 2022 | 2118962000 | 1515000000 |
| Sunday, January 1, 2023 | 1972689000 | 1556000000 |
| Monday, January 1, 2024 | 1422000000 |
Unveiling the hidden dimensions of data
In the world of logistics and manufacturing, Old Dominion Freight Line and Textron Inc. have been pivotal players. Over the past decade, these companies have showcased intriguing trends in their EBITDA, a key financial metric. From 2014 to 2023, Old Dominion Freight Line's EBITDA surged by approximately 237%, peaking in 2022. This growth reflects the company's robust operational strategies and market adaptability. In contrast, Textron Inc. experienced a more modest 1% increase over the same period, with notable fluctuations, particularly in 2020 when their EBITDA dropped by nearly 45% compared to the previous year. This divergence highlights the dynamic nature of these industries and the varying challenges they face. As we look to the future, the missing data for 2024 leaves room for speculation and anticipation about the next chapter in this financial narrative.
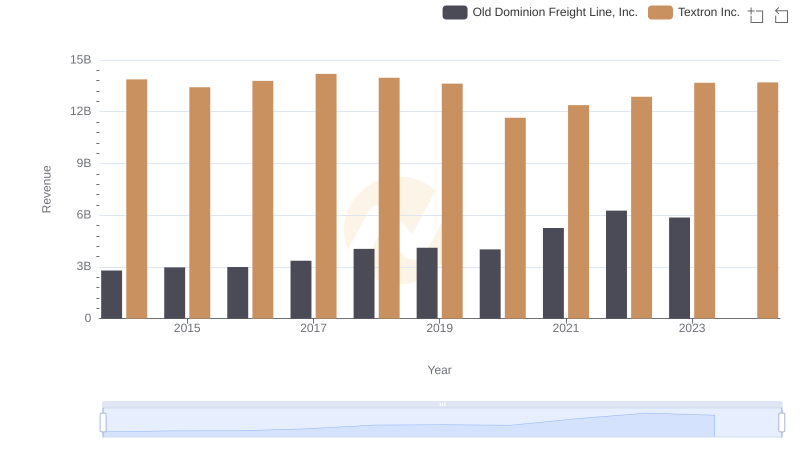
Comparing Revenue Performance: Old Dominion Freight Line, Inc. or Textron Inc.?
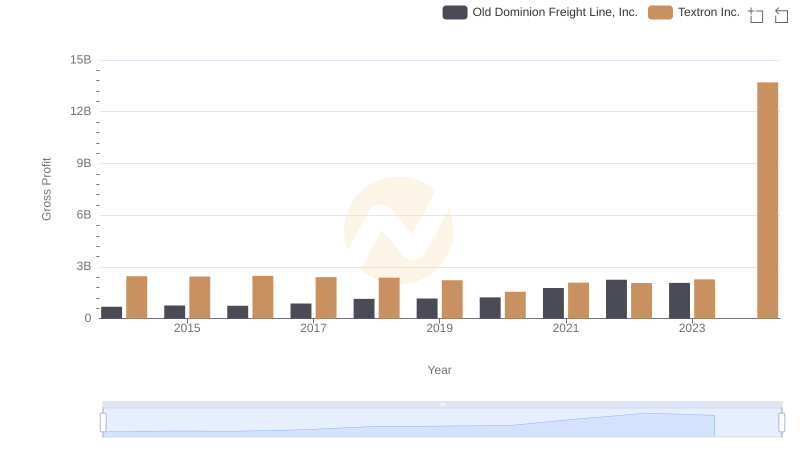
Old Dominion Freight Line, Inc. vs Textron Inc.: A Gross Profit Performance Breakdown
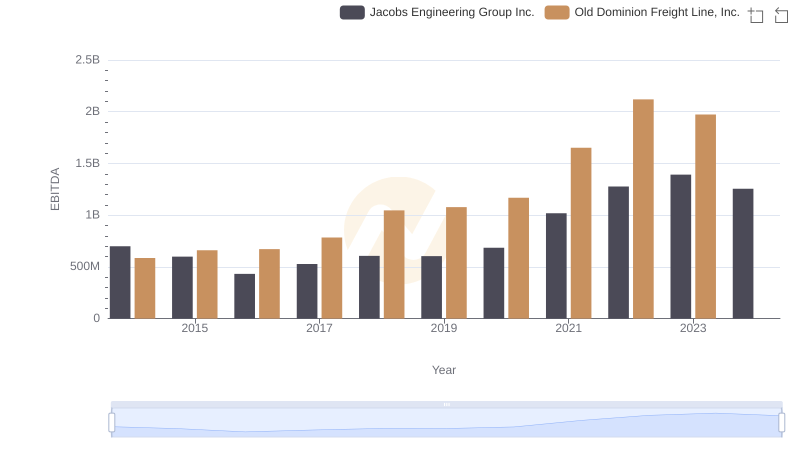
EBITDA Metrics Evaluated: Old Dominion Freight Line, Inc. vs Jacobs Engineering Group Inc.
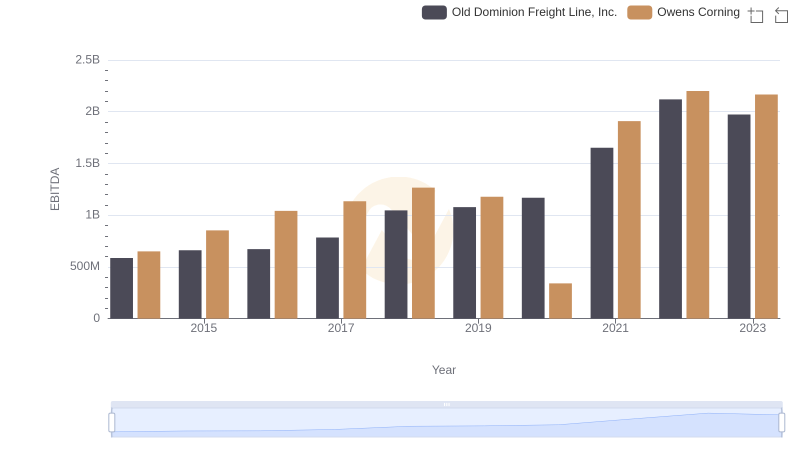
A Professional Review of EBITDA: Old Dominion Freight Line, Inc. Compared to Owens Corning
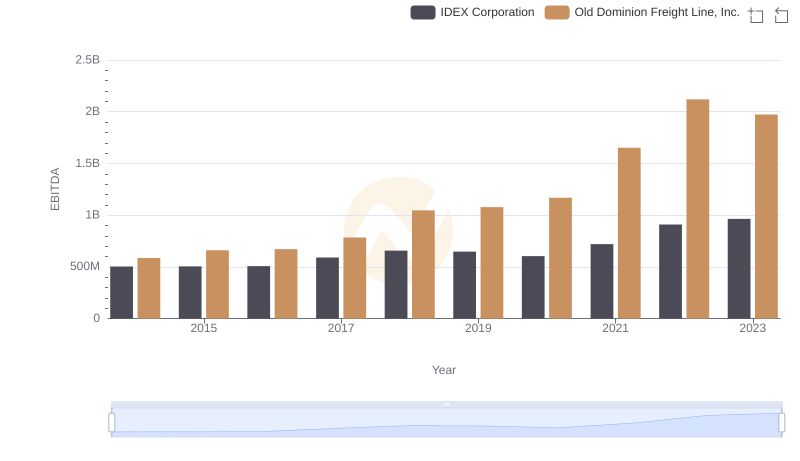
A Side-by-Side Analysis of EBITDA: Old Dominion Freight Line, Inc. and IDEX Corporation
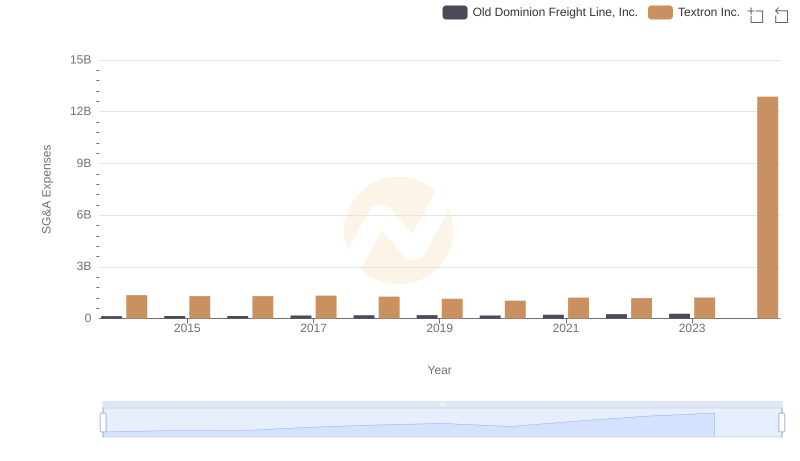
SG&A Efficiency Analysis: Comparing Old Dominion Freight Line, Inc. and Textron Inc.
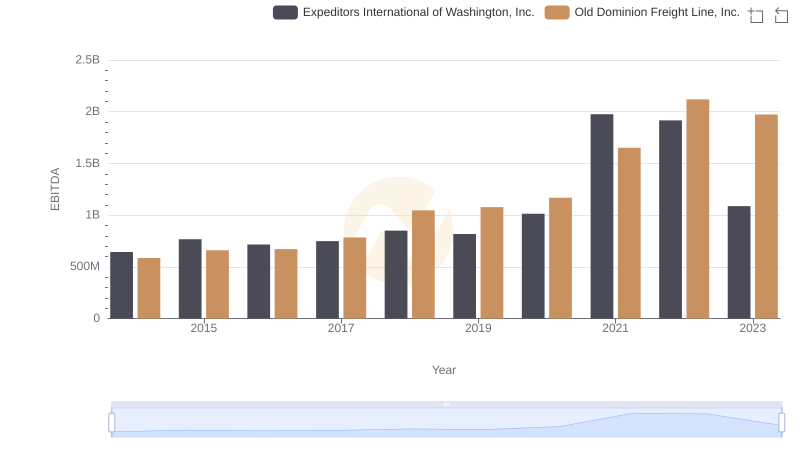
EBITDA Metrics Evaluated: Old Dominion Freight Line, Inc. vs Expeditors International of Washington, Inc.
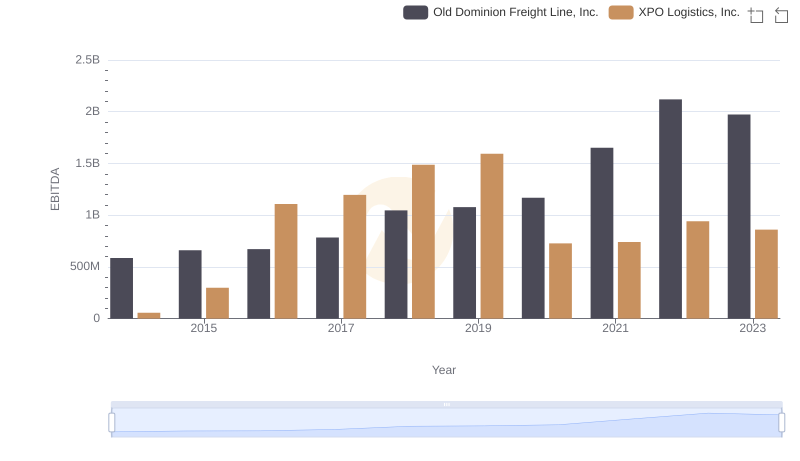
Old Dominion Freight Line, Inc. and XPO Logistics, Inc.: A Detailed Examination of EBITDA Performance
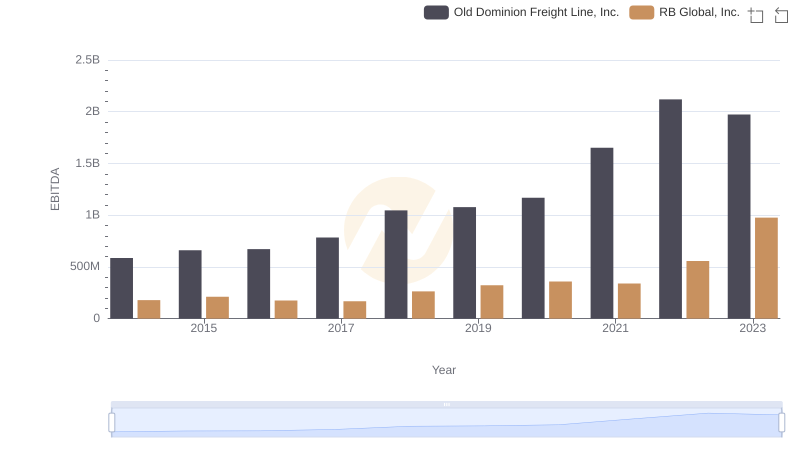
EBITDA Analysis: Evaluating Old Dominion Freight Line, Inc. Against RB Global, Inc.
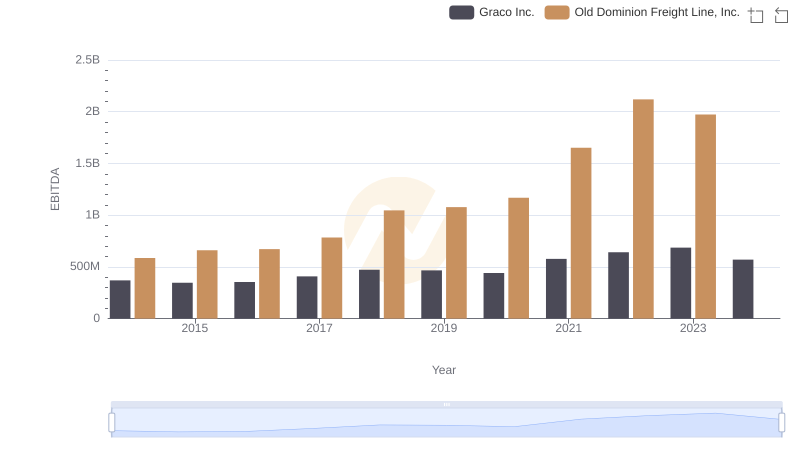
Comparative EBITDA Analysis: Old Dominion Freight Line, Inc. vs Graco Inc.
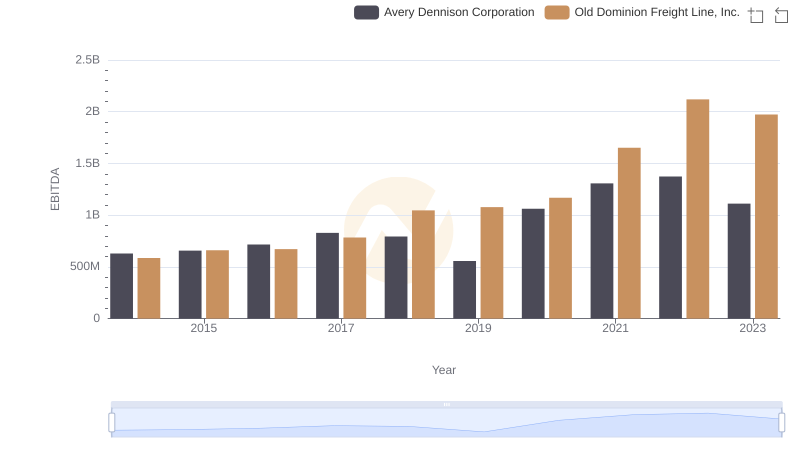
A Professional Review of EBITDA: Old Dominion Freight Line, Inc. Compared to Avery Dennison Corporation