| __timestamp | Jacobs Engineering Group Inc. | Old Dominion Freight Line, Inc. |
|---|---|---|
| Wednesday, January 1, 2014 | 699015000 | 585590000 |
| Thursday, January 1, 2015 | 598932000 | 660570000 |
| Friday, January 1, 2016 | 431954000 | 671786000 |
| Sunday, January 1, 2017 | 527765000 | 783749000 |
| Monday, January 1, 2018 | 606328000 | 1046059000 |
| Tuesday, January 1, 2019 | 604075000 | 1078007000 |
| Wednesday, January 1, 2020 | 685042000 | 1168149000 |
| Friday, January 1, 2021 | 1019116000 | 1651501000 |
| Saturday, January 1, 2022 | 1277649000 | 2118962000 |
| Sunday, January 1, 2023 | 1392039000 | 1972689000 |
| Monday, January 1, 2024 | 1255083000 |
In pursuit of knowledge
In the ever-evolving landscape of American industry, Old Dominion Freight Line, Inc. and Jacobs Engineering Group Inc. stand as formidable players. Over the past decade, these companies have showcased remarkable growth in their EBITDA, a key indicator of financial health. From 2014 to 2023, Old Dominion Freight Line's EBITDA surged by approximately 238%, peaking in 2022. Meanwhile, Jacobs Engineering experienced a robust 99% increase, reaching its zenith in 2023.
Old Dominion's consistent upward trajectory highlights its strategic prowess in the freight industry, while Jacobs Engineering's growth underscores its adaptability in engineering services. Notably, 2024 data for Old Dominion is missing, leaving room for speculation on its future performance. As these giants continue to shape their respective sectors, investors and industry watchers alike are keenly observing their next moves.
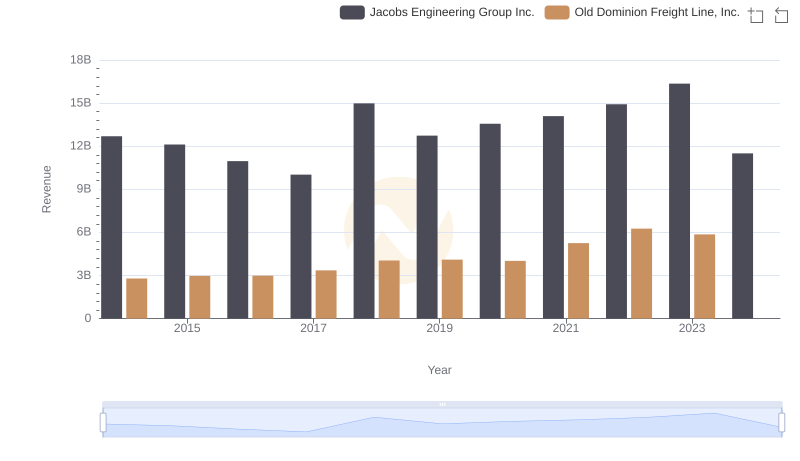
Comparing Revenue Performance: Old Dominion Freight Line, Inc. or Jacobs Engineering Group Inc.?
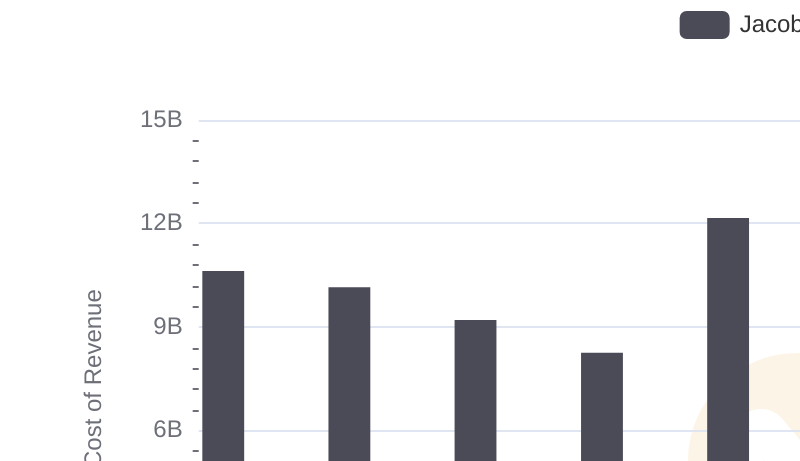
Cost of Revenue Comparison: Old Dominion Freight Line, Inc. vs Jacobs Engineering Group Inc.
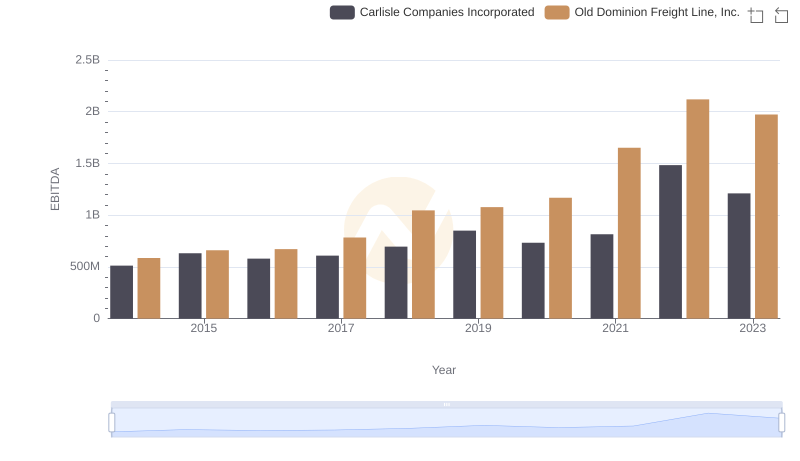
Old Dominion Freight Line, Inc. and Carlisle Companies Incorporated: A Detailed Examination of EBITDA Performance
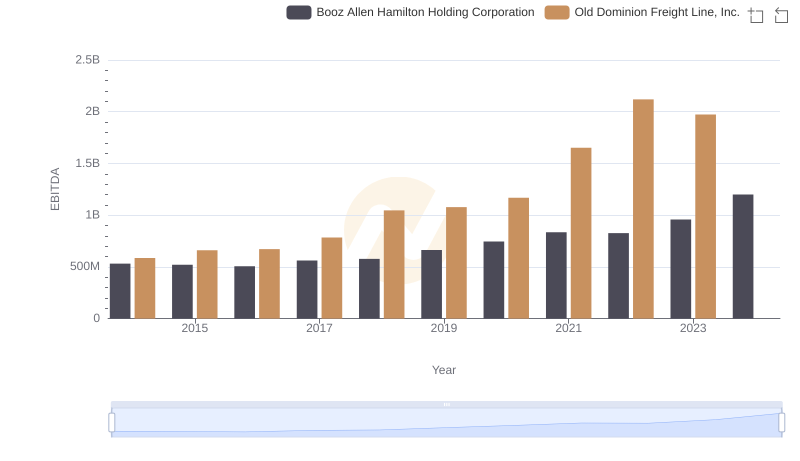
A Professional Review of EBITDA: Old Dominion Freight Line, Inc. Compared to Booz Allen Hamilton Holding Corporation

EBITDA Performance Review: Old Dominion Freight Line, Inc. vs Pentair plc
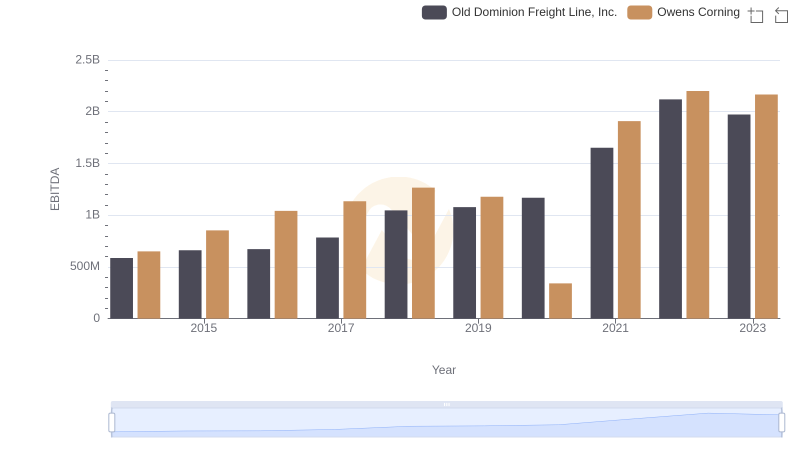
A Professional Review of EBITDA: Old Dominion Freight Line, Inc. Compared to Owens Corning
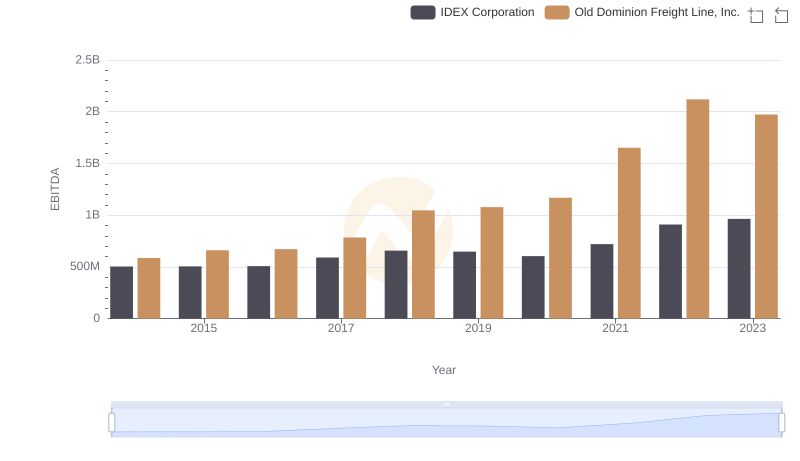
A Side-by-Side Analysis of EBITDA: Old Dominion Freight Line, Inc. and IDEX Corporation
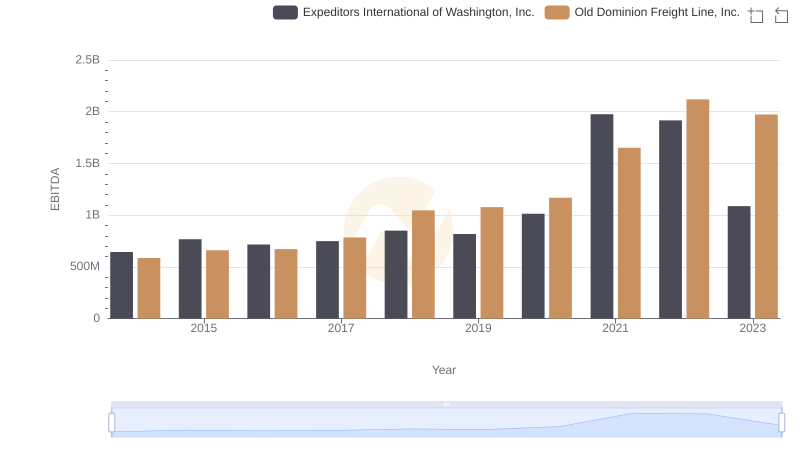
EBITDA Metrics Evaluated: Old Dominion Freight Line, Inc. vs Expeditors International of Washington, Inc.
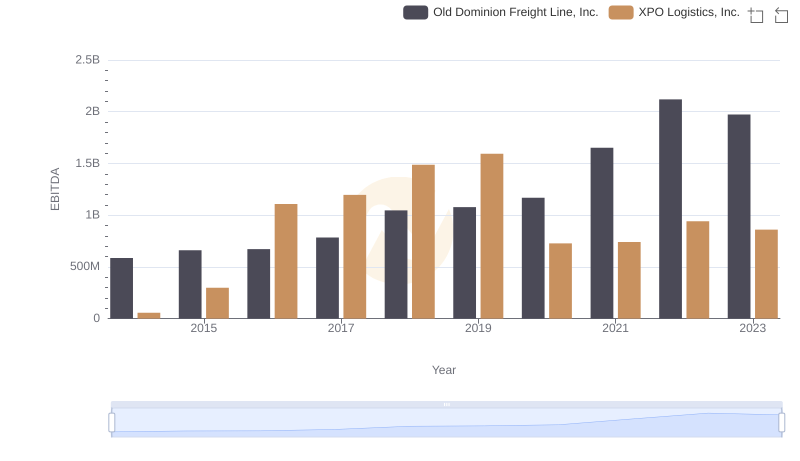
Old Dominion Freight Line, Inc. and XPO Logistics, Inc.: A Detailed Examination of EBITDA Performance