| __timestamp | Old Dominion Freight Line, Inc. | Textron Inc. |
|---|---|---|
| Wednesday, January 1, 2014 | 687488000 | 2457000000 |
| Thursday, January 1, 2015 | 757499000 | 2444000000 |
| Friday, January 1, 2016 | 744627000 | 2477000000 |
| Sunday, January 1, 2017 | 875380000 | 2403000000 |
| Monday, January 1, 2018 | 1144243000 | 2378000000 |
| Tuesday, January 1, 2019 | 1170216000 | 2224000000 |
| Wednesday, January 1, 2020 | 1228598000 | 1557000000 |
| Friday, January 1, 2021 | 1775060000 | 2085000000 |
| Saturday, January 1, 2022 | 2256126000 | 2069000000 |
| Sunday, January 1, 2023 | 2072199000 | 2278000000 |
| Monday, January 1, 2024 | 2502000000 |
Unveiling the hidden dimensions of data
In the competitive landscape of American industry, Old Dominion Freight Line and Textron Inc. have carved out significant niches. From 2014 to 2023, Old Dominion Freight Line's gross profit surged by over 200%, peaking in 2022. This growth reflects the company's strategic expansion and operational efficiency. Meanwhile, Textron Inc. experienced a more modest 7% increase in gross profit over the same period, with a notable dip in 2020, likely due to pandemic-related disruptions.
This analysis underscores the resilience and adaptability of these industry leaders, offering valuable insights for investors and market analysts alike.
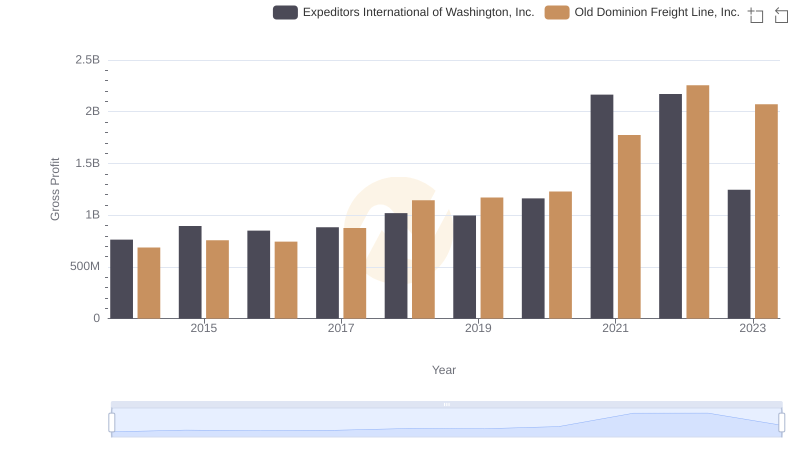
Gross Profit Analysis: Comparing Old Dominion Freight Line, Inc. and Expeditors International of Washington, Inc.
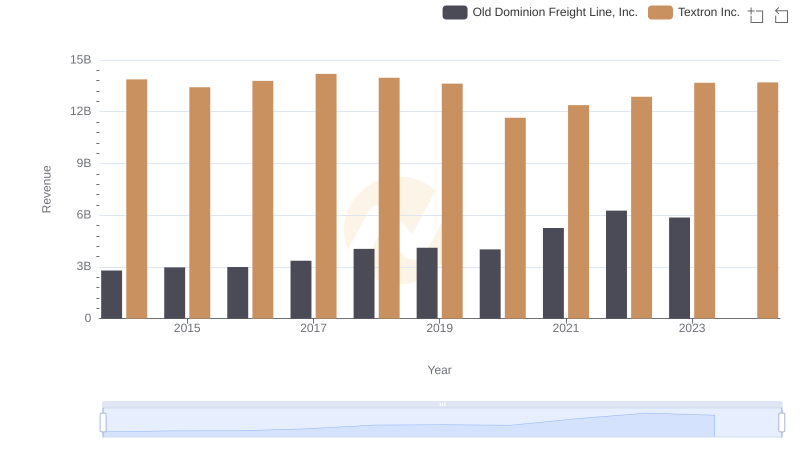
Comparing Revenue Performance: Old Dominion Freight Line, Inc. or Textron Inc.?
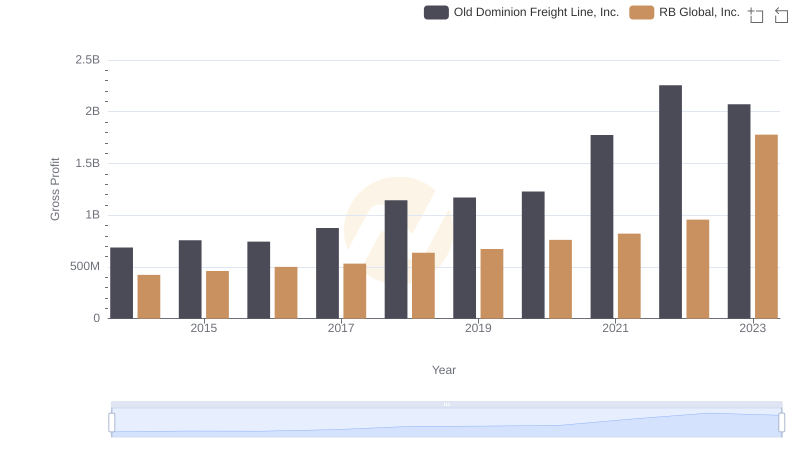
Key Insights on Gross Profit: Old Dominion Freight Line, Inc. vs RB Global, Inc.
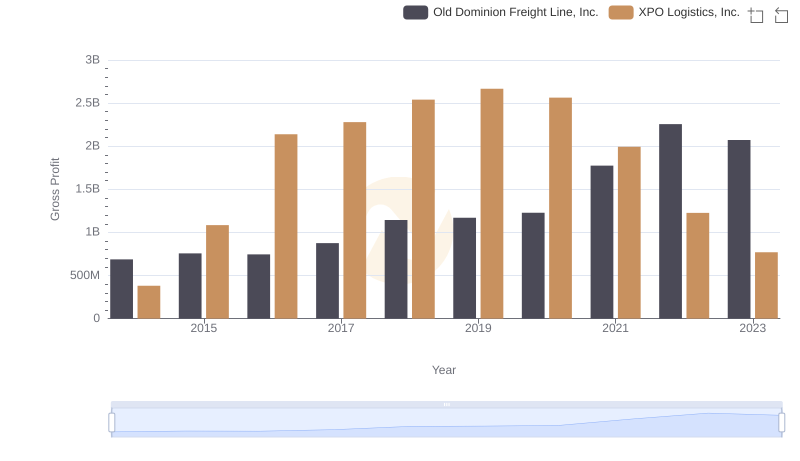
Key Insights on Gross Profit: Old Dominion Freight Line, Inc. vs XPO Logistics, Inc.
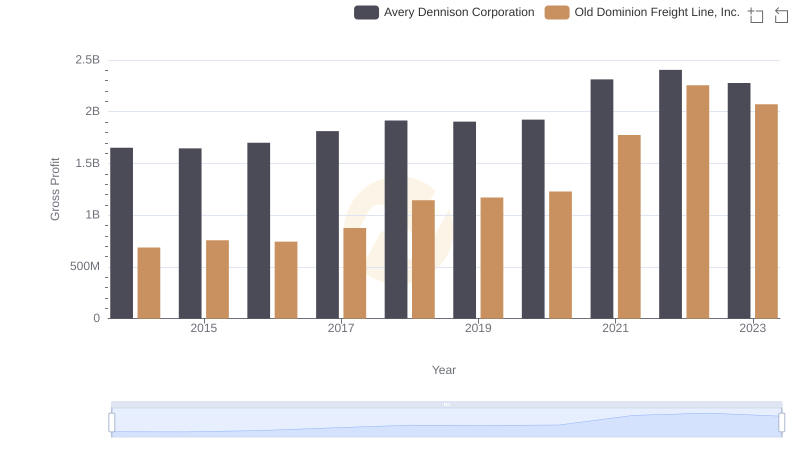
Gross Profit Analysis: Comparing Old Dominion Freight Line, Inc. and Avery Dennison Corporation
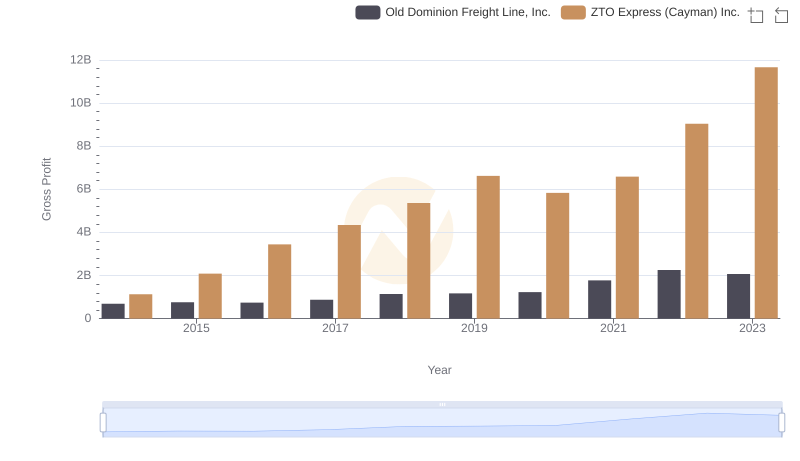
Gross Profit Comparison: Old Dominion Freight Line, Inc. and ZTO Express (Cayman) Inc. Trends
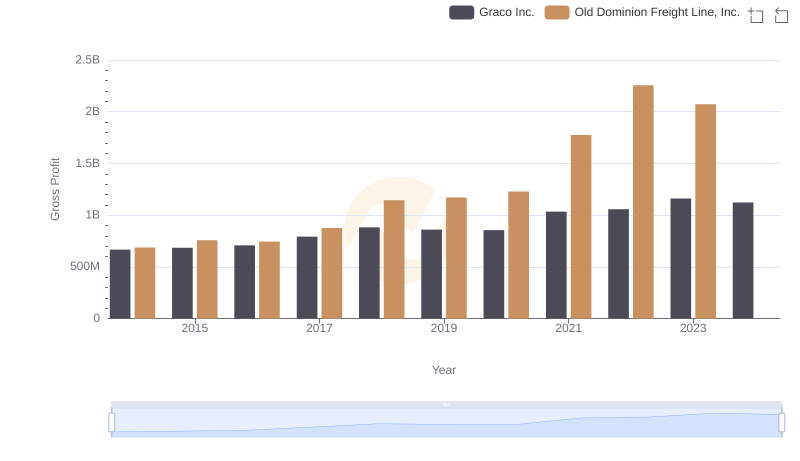
Old Dominion Freight Line, Inc. and Graco Inc.: A Detailed Gross Profit Analysis
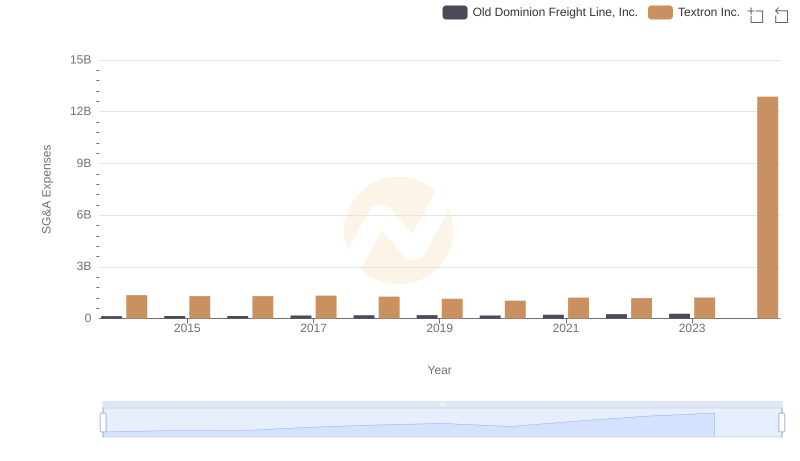
SG&A Efficiency Analysis: Comparing Old Dominion Freight Line, Inc. and Textron Inc.
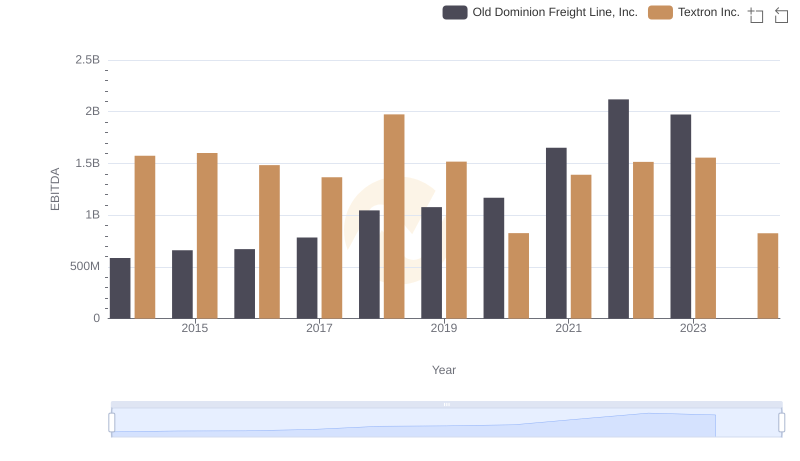
EBITDA Metrics Evaluated: Old Dominion Freight Line, Inc. vs Textron Inc.