| __timestamp | Avery Dennison Corporation | Old Dominion Freight Line, Inc. |
|---|---|---|
| Wednesday, January 1, 2014 | 629200000 | 585590000 |
| Thursday, January 1, 2015 | 657700000 | 660570000 |
| Friday, January 1, 2016 | 717000000 | 671786000 |
| Sunday, January 1, 2017 | 829400000 | 783749000 |
| Monday, January 1, 2018 | 794300000 | 1046059000 |
| Tuesday, January 1, 2019 | 557500000 | 1078007000 |
| Wednesday, January 1, 2020 | 1062000000 | 1168149000 |
| Friday, January 1, 2021 | 1306900000 | 1651501000 |
| Saturday, January 1, 2022 | 1374100000 | 2118962000 |
| Sunday, January 1, 2023 | 1112100000 | 1972689000 |
| Monday, January 1, 2024 | 1382700000 |
In pursuit of knowledge
In the world of logistics and manufacturing, Old Dominion Freight Line, Inc. and Avery Dennison Corporation have been key players. Over the past decade, their EBITDA performances have painted a fascinating picture of growth and resilience. From 2014 to 2023, Old Dominion Freight Line's EBITDA surged by an impressive 237%, peaking in 2022. Meanwhile, Avery Dennison saw a 118% increase, with its highest EBITDA recorded in 2022 as well.
Old Dominion Freight Line consistently outperformed Avery Dennison, especially from 2018 onwards, where it maintained a lead of over 30% in EBITDA. The year 2020 marked a turning point for both companies, with Old Dominion's EBITDA surpassing Avery Dennison's by 10%. This trend continued, highlighting Old Dominion's robust growth strategy and market adaptability.
As we look to the future, these insights offer a glimpse into the strategic maneuvers that have defined these industry giants.
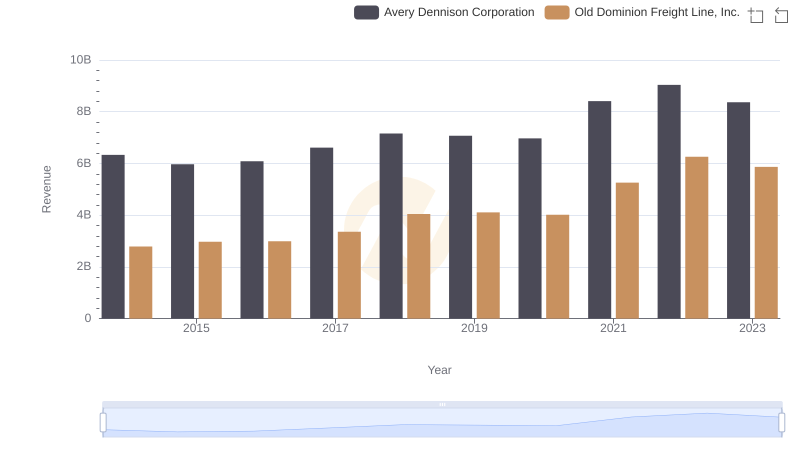
Old Dominion Freight Line, Inc. vs Avery Dennison Corporation: Examining Key Revenue Metrics
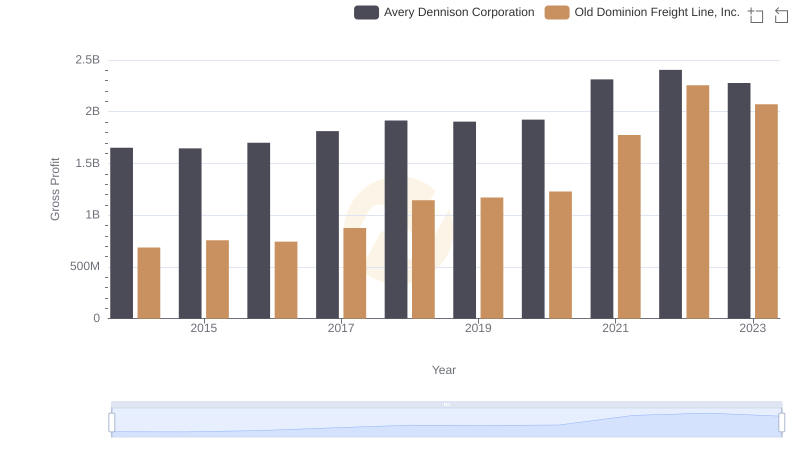
Gross Profit Analysis: Comparing Old Dominion Freight Line, Inc. and Avery Dennison Corporation
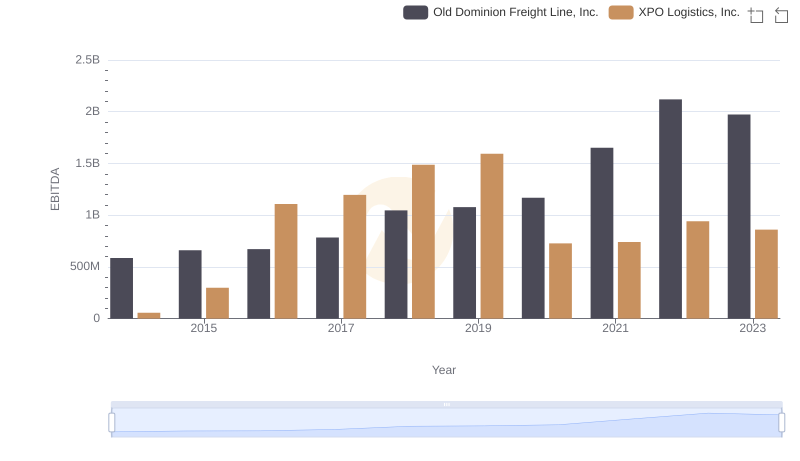
Old Dominion Freight Line, Inc. and XPO Logistics, Inc.: A Detailed Examination of EBITDA Performance
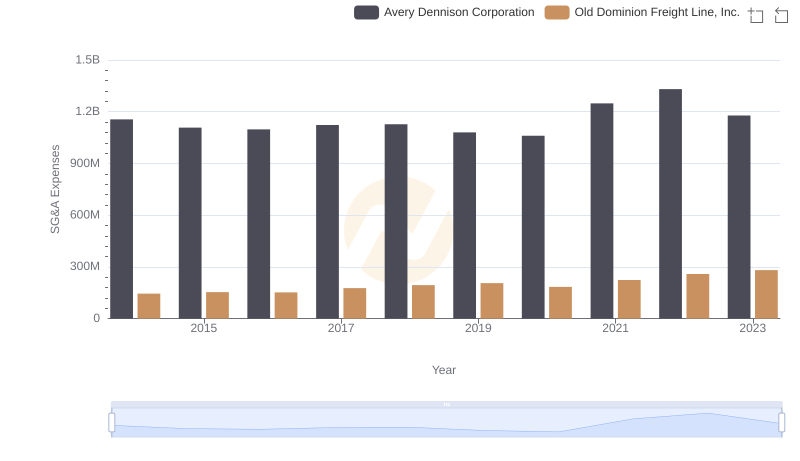
Cost Management Insights: SG&A Expenses for Old Dominion Freight Line, Inc. and Avery Dennison Corporation
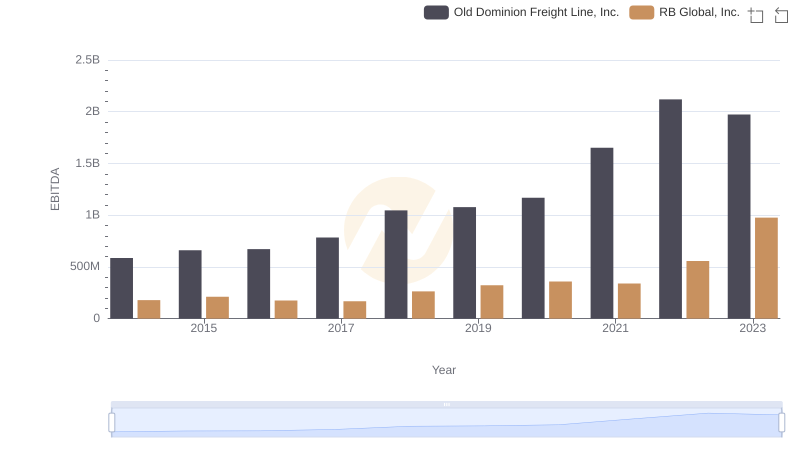
EBITDA Analysis: Evaluating Old Dominion Freight Line, Inc. Against RB Global, Inc.
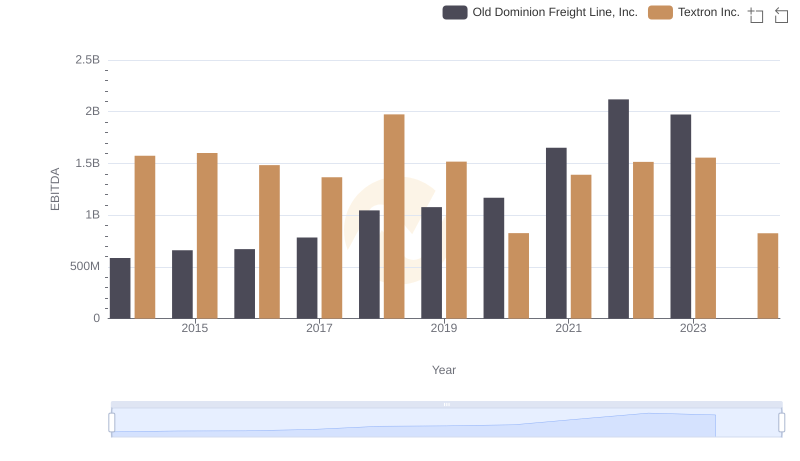
EBITDA Metrics Evaluated: Old Dominion Freight Line, Inc. vs Textron Inc.
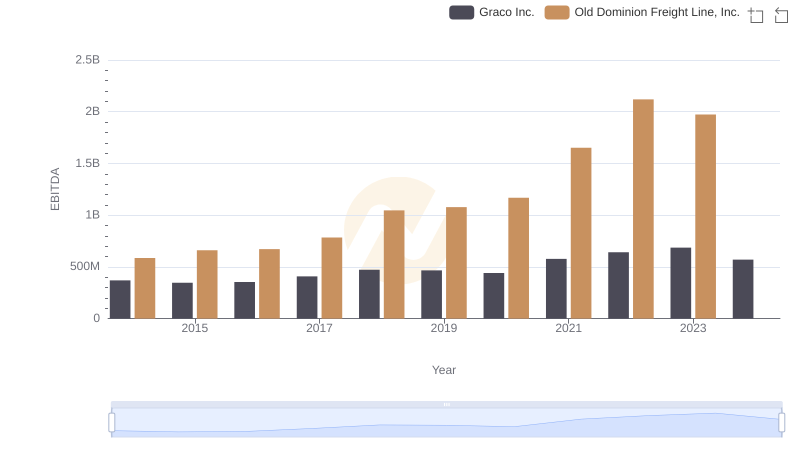
Comparative EBITDA Analysis: Old Dominion Freight Line, Inc. vs Graco Inc.
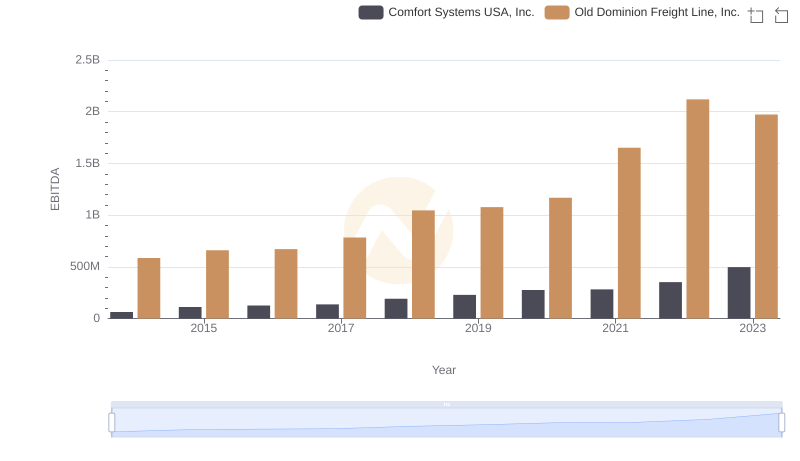
Professional EBITDA Benchmarking: Old Dominion Freight Line, Inc. vs Comfort Systems USA, Inc.
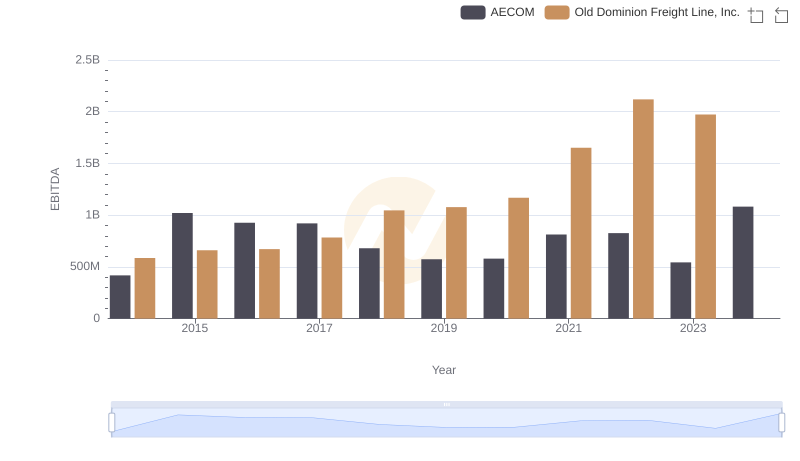
Old Dominion Freight Line, Inc. and AECOM: A Detailed Examination of EBITDA Performance