| __timestamp | Old Dominion Freight Line, Inc. | XPO Logistics, Inc. |
|---|---|---|
| Wednesday, January 1, 2014 | 585590000 | 56600000 |
| Thursday, January 1, 2015 | 660570000 | 298000000 |
| Friday, January 1, 2016 | 671786000 | 1108300000 |
| Sunday, January 1, 2017 | 783749000 | 1196700000 |
| Monday, January 1, 2018 | 1046059000 | 1488000000 |
| Tuesday, January 1, 2019 | 1078007000 | 1594000000 |
| Wednesday, January 1, 2020 | 1168149000 | 727000000 |
| Friday, January 1, 2021 | 1651501000 | 741000000 |
| Saturday, January 1, 2022 | 2118962000 | 941000000 |
| Sunday, January 1, 2023 | 1972689000 | 860000000 |
| Monday, January 1, 2024 | 1186000000 |
Data in motion
In the competitive world of freight and logistics, understanding financial performance is crucial. Over the past decade, Old Dominion Freight Line, Inc. and XPO Logistics, Inc. have showcased intriguing EBITDA trends. From 2014 to 2023, Old Dominion's EBITDA surged by approximately 237%, peaking in 2022. This growth reflects their strategic expansion and operational efficiency. Meanwhile, XPO Logistics experienced a more volatile journey, with a notable peak in 2019, followed by a dip in 2020, and a gradual recovery thereafter. By 2023, Old Dominion's EBITDA was more than double that of XPO, highlighting their robust financial health. This comparison not only underscores the dynamic nature of the logistics industry but also emphasizes the importance of strategic planning and adaptability in achieving sustained growth.
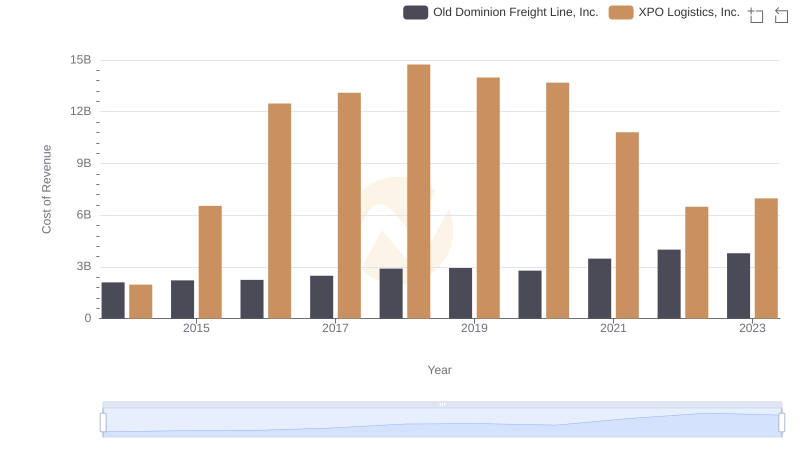
Cost of Revenue: Key Insights for Old Dominion Freight Line, Inc. and XPO Logistics, Inc.
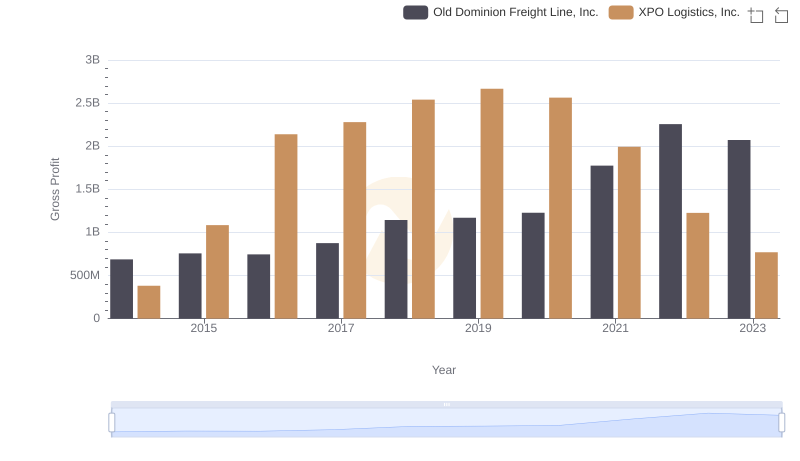
Key Insights on Gross Profit: Old Dominion Freight Line, Inc. vs XPO Logistics, Inc.

EBITDA Performance Review: Old Dominion Freight Line, Inc. vs Pentair plc
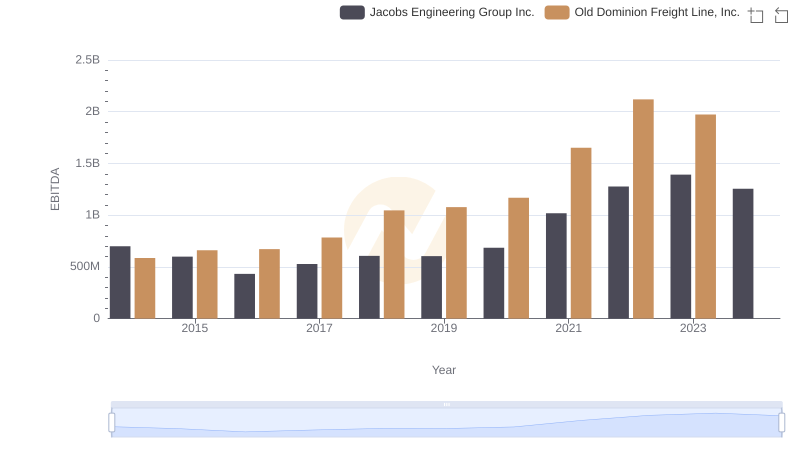
EBITDA Metrics Evaluated: Old Dominion Freight Line, Inc. vs Jacobs Engineering Group Inc.
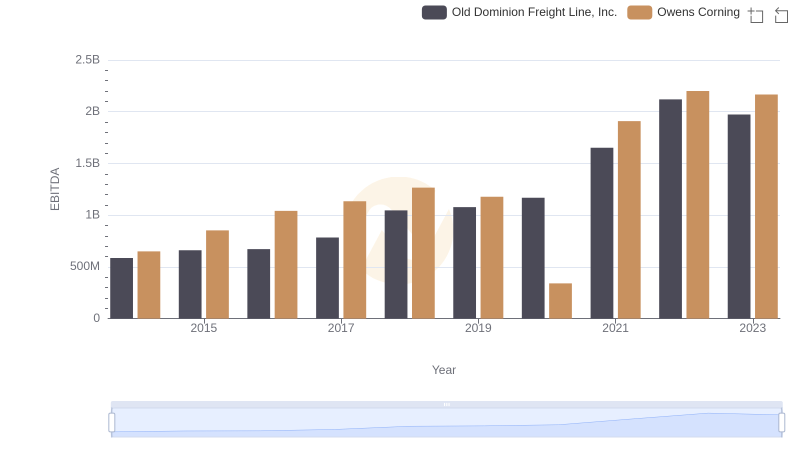
A Professional Review of EBITDA: Old Dominion Freight Line, Inc. Compared to Owens Corning
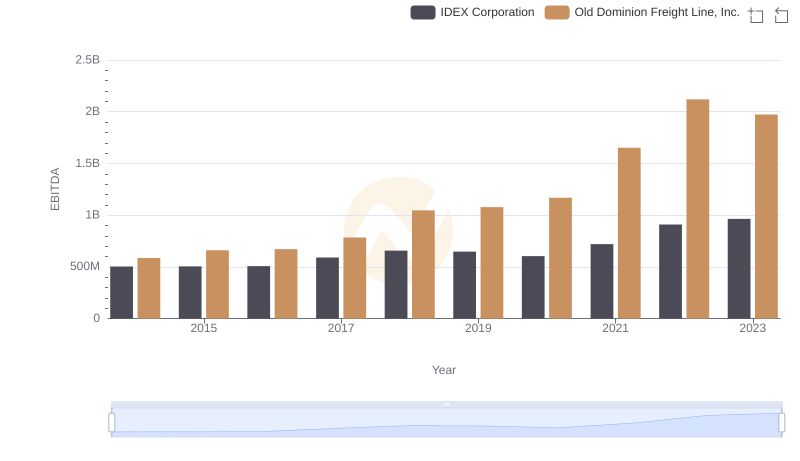
A Side-by-Side Analysis of EBITDA: Old Dominion Freight Line, Inc. and IDEX Corporation
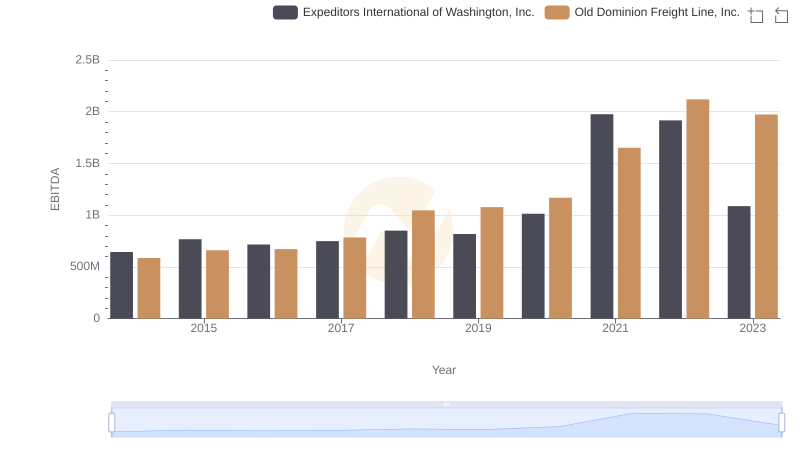
EBITDA Metrics Evaluated: Old Dominion Freight Line, Inc. vs Expeditors International of Washington, Inc.
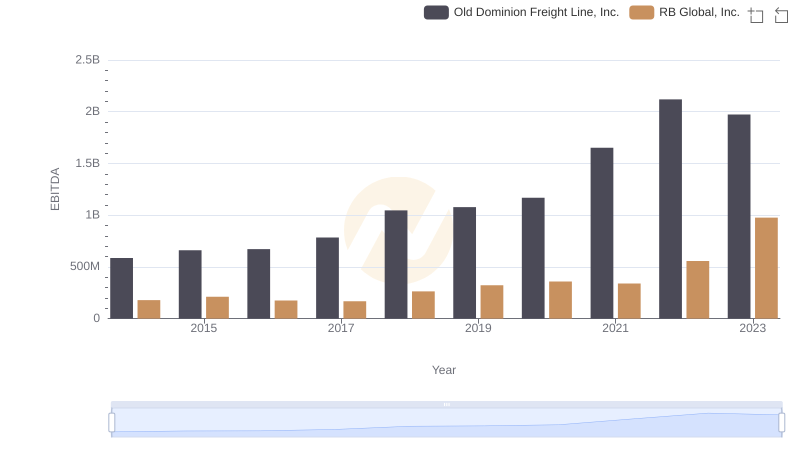
EBITDA Analysis: Evaluating Old Dominion Freight Line, Inc. Against RB Global, Inc.
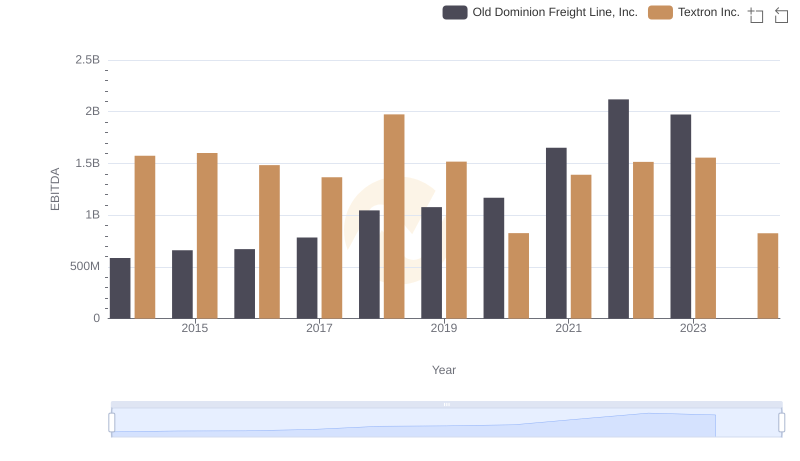
EBITDA Metrics Evaluated: Old Dominion Freight Line, Inc. vs Textron Inc.