| __timestamp | Graco Inc. | Old Dominion Freight Line, Inc. |
|---|---|---|
| Wednesday, January 1, 2014 | 369321000 | 585590000 |
| Thursday, January 1, 2015 | 346732000 | 660570000 |
| Friday, January 1, 2016 | 354454000 | 671786000 |
| Sunday, January 1, 2017 | 408879000 | 783749000 |
| Monday, January 1, 2018 | 472905000 | 1046059000 |
| Tuesday, January 1, 2019 | 466687000 | 1078007000 |
| Wednesday, January 1, 2020 | 440431000 | 1168149000 |
| Friday, January 1, 2021 | 578005000 | 1651501000 |
| Saturday, January 1, 2022 | 641618000 | 2118962000 |
| Sunday, January 1, 2023 | 686593000 | 1972689000 |
| Monday, January 1, 2024 | 570098000 |
Unleashing the power of data
In the ever-evolving landscape of American industry, two giants stand out: Old Dominion Freight Line, Inc. and Graco Inc. Over the past decade, these companies have demonstrated remarkable financial performance, as evidenced by their EBITDA trends. From 2014 to 2023, Old Dominion Freight Line, Inc. has consistently outperformed Graco Inc., with an average EBITDA nearly 2.5 times higher. Notably, in 2022, Old Dominion reached a peak EBITDA, marking a 260% increase from its 2014 figures. Meanwhile, Graco Inc. has shown steady growth, achieving a 90% increase in EBITDA over the same period. However, 2024 data for Old Dominion is missing, leaving room for speculation on its future trajectory. This analysis highlights the resilience and strategic prowess of these companies in navigating economic challenges and capitalizing on growth opportunities.
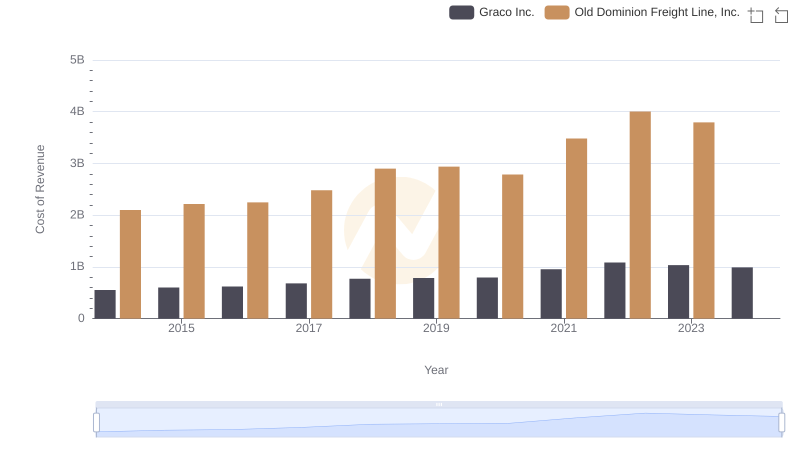
Cost of Revenue Comparison: Old Dominion Freight Line, Inc. vs Graco Inc.
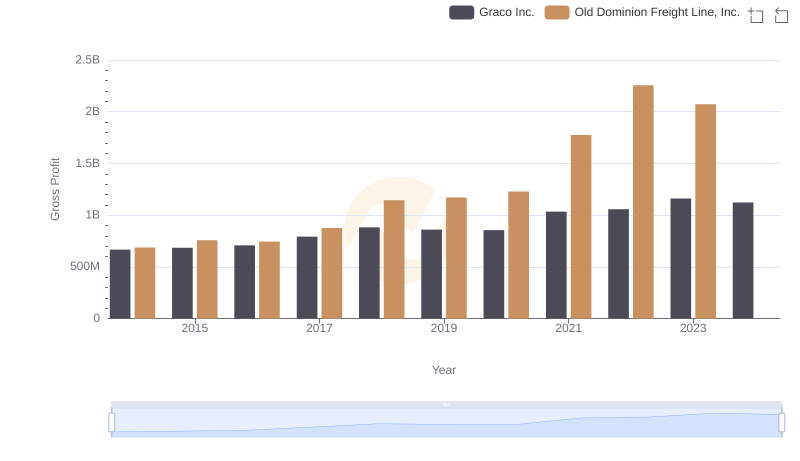
Old Dominion Freight Line, Inc. and Graco Inc.: A Detailed Gross Profit Analysis
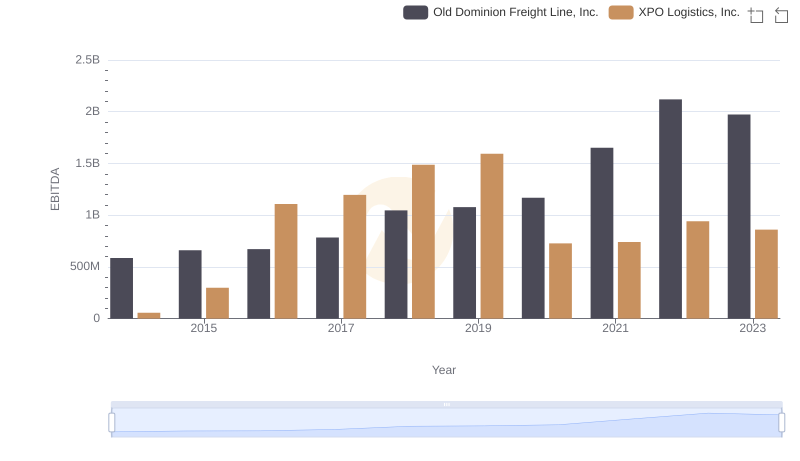
Old Dominion Freight Line, Inc. and XPO Logistics, Inc.: A Detailed Examination of EBITDA Performance
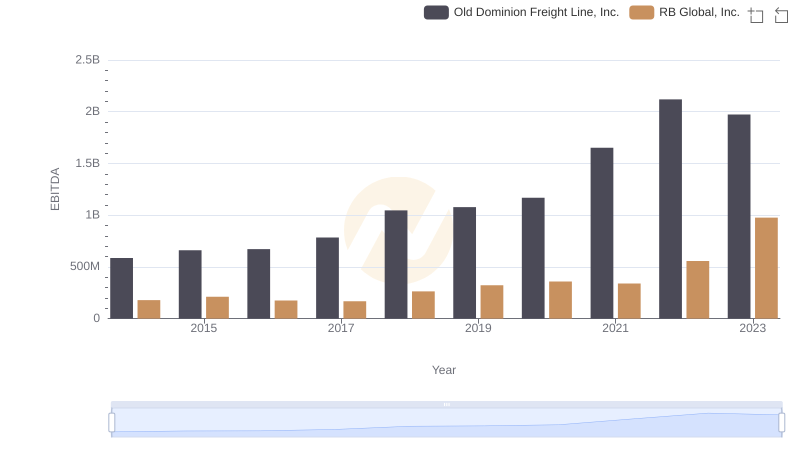
EBITDA Analysis: Evaluating Old Dominion Freight Line, Inc. Against RB Global, Inc.
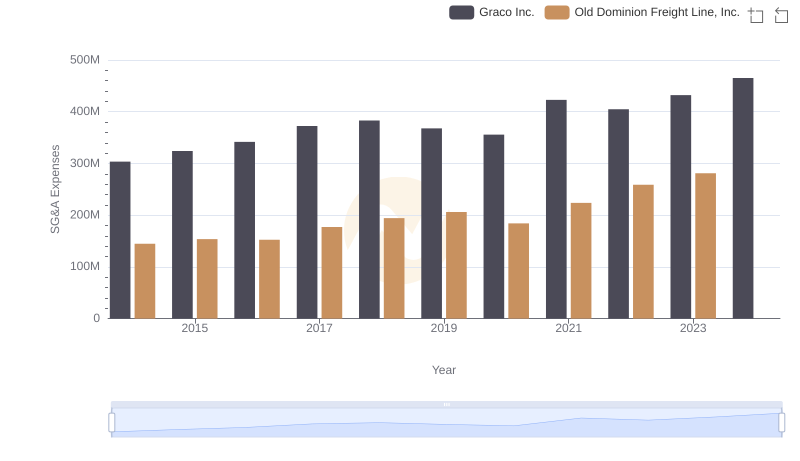
Old Dominion Freight Line, Inc. vs Graco Inc.: SG&A Expense Trends
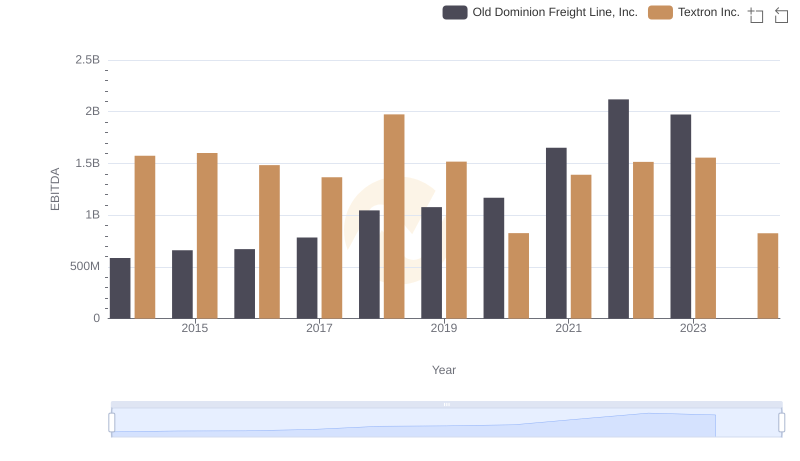
EBITDA Metrics Evaluated: Old Dominion Freight Line, Inc. vs Textron Inc.
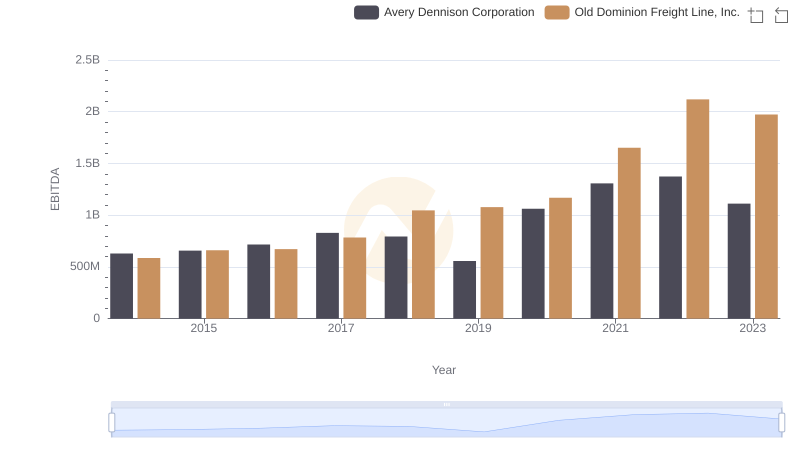
A Professional Review of EBITDA: Old Dominion Freight Line, Inc. Compared to Avery Dennison Corporation
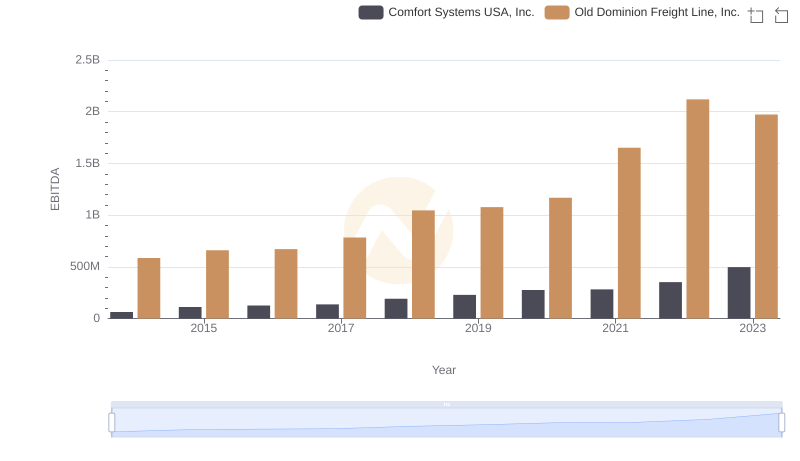
Professional EBITDA Benchmarking: Old Dominion Freight Line, Inc. vs Comfort Systems USA, Inc.
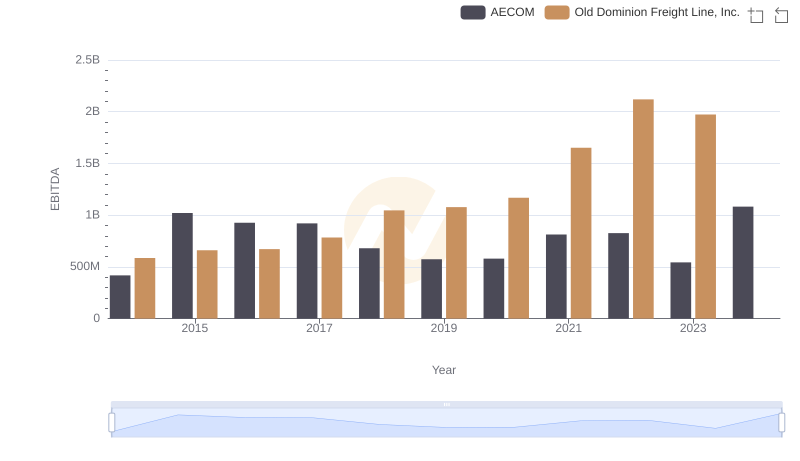
Old Dominion Freight Line, Inc. and AECOM: A Detailed Examination of EBITDA Performance