| __timestamp | Infosys Limited | Teradyne, Inc. |
|---|---|---|
| Wednesday, January 1, 2014 | 2258000000 | 355804000 |
| Thursday, January 1, 2015 | 2590000000 | 390438000 |
| Friday, January 1, 2016 | 2765000000 | 68085999 |
| Sunday, January 1, 2017 | 2936000000 | 647992000 |
| Monday, January 1, 2018 | 2984000000 | 603746000 |
| Tuesday, January 1, 2019 | 3053000000 | 650398000 |
| Wednesday, January 1, 2020 | 4053342784 | 1036119000 |
| Friday, January 1, 2021 | 4116000000 | 1291304000 |
| Saturday, January 1, 2022 | 4707334610 | 954200000 |
| Sunday, January 1, 2023 | 4206000000 | 640495000 |
| Monday, January 1, 2024 | 593788000 |
Cracking the code
In the ever-evolving landscape of global technology, understanding financial health is crucial. This analysis delves into the EBITDA performance of two industry giants, Infosys Limited and Teradyne, Inc., from 2014 to 2023.
Infosys, a leader in IT services, consistently outperformed Teradyne, a key player in semiconductor testing, with an average EBITDA nearly five times higher. Notably, Infosys saw a remarkable 86% growth in EBITDA from 2014 to 2022, peaking in 2022. In contrast, Teradyne experienced a more volatile journey, with a significant spike in 2021, reaching its highest EBITDA, yet still trailing behind Infosys.
This financial trajectory highlights the resilience and strategic prowess of Infosys in maintaining steady growth, while Teradyne's fluctuations reflect the dynamic nature of the semiconductor industry. Investors and analysts can glean valuable insights into the operational efficiencies and market strategies of these tech titans.
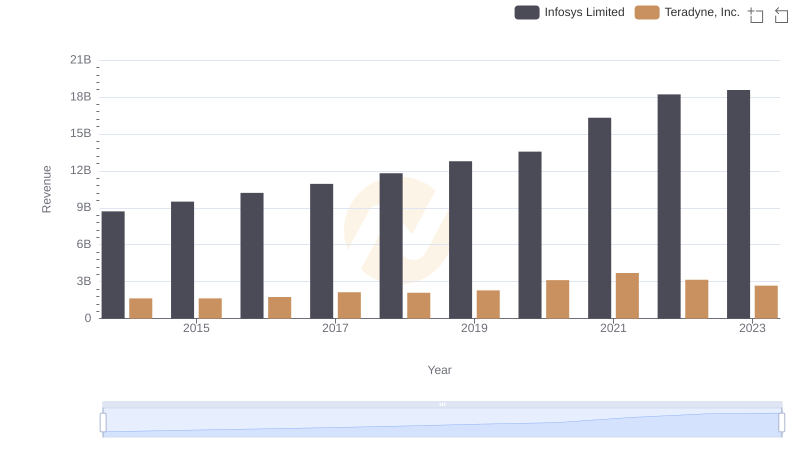
Who Generates More Revenue? Infosys Limited or Teradyne, Inc.
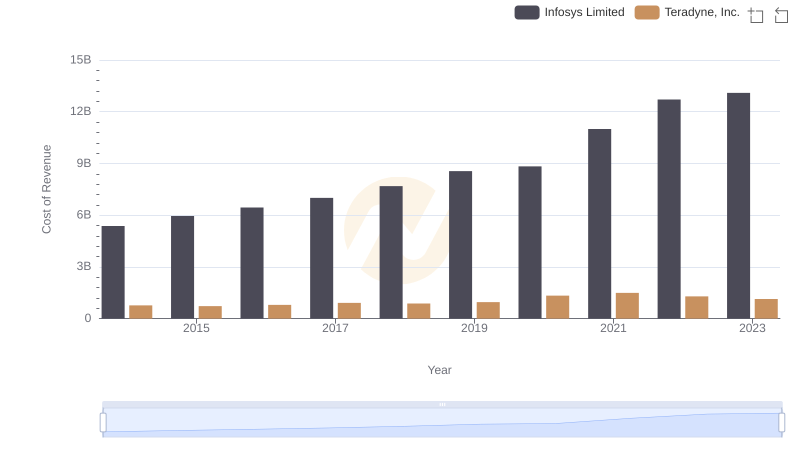
Analyzing Cost of Revenue: Infosys Limited and Teradyne, Inc.
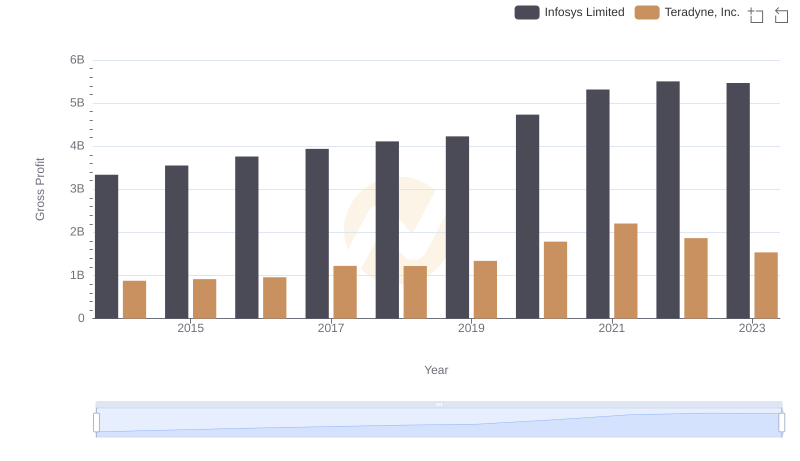
Infosys Limited vs Teradyne, Inc.: A Gross Profit Performance Breakdown
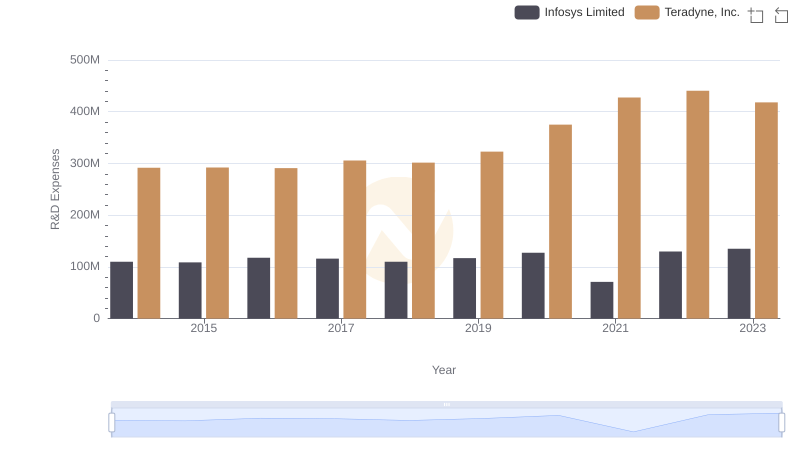
Who Prioritizes Innovation? R&D Spending Compared for Infosys Limited and Teradyne, Inc.
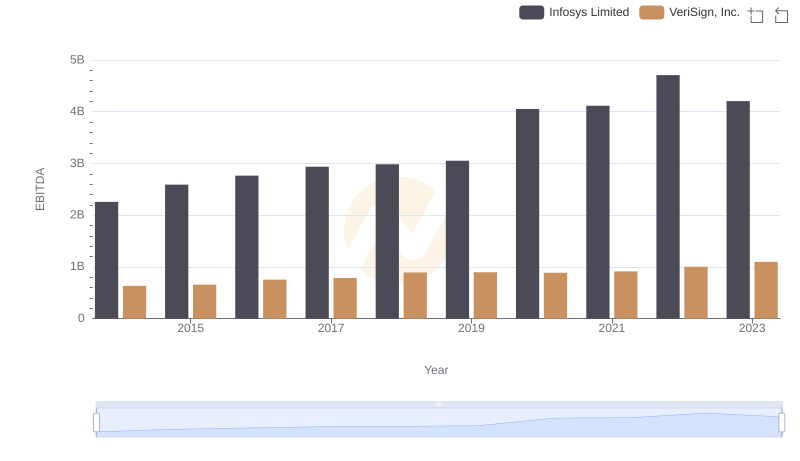
EBITDA Analysis: Evaluating Infosys Limited Against VeriSign, Inc.

Breaking Down SG&A Expenses: Infosys Limited vs Teradyne, Inc.
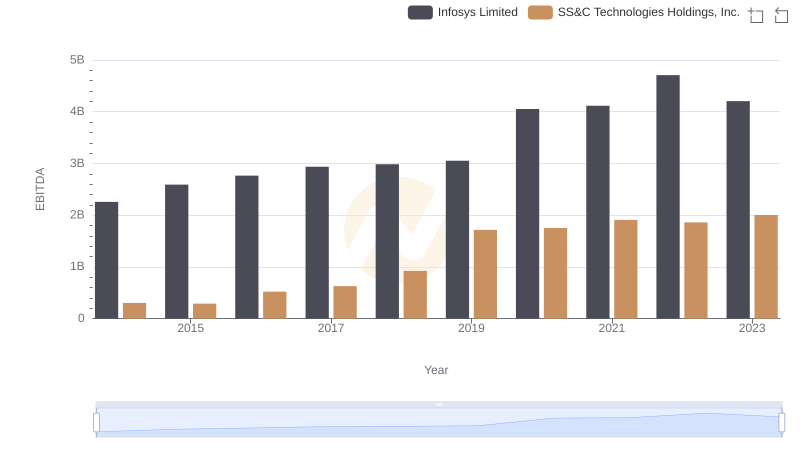
Comparative EBITDA Analysis: Infosys Limited vs SS&C Technologies Holdings, Inc.
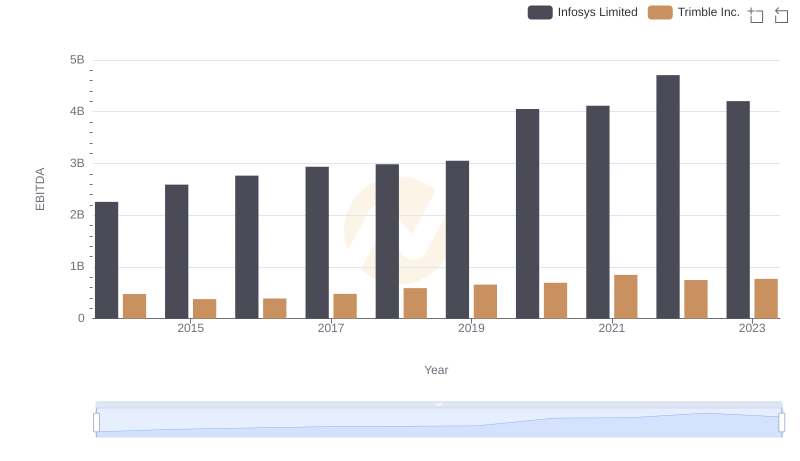
A Side-by-Side Analysis of EBITDA: Infosys Limited and Trimble Inc.
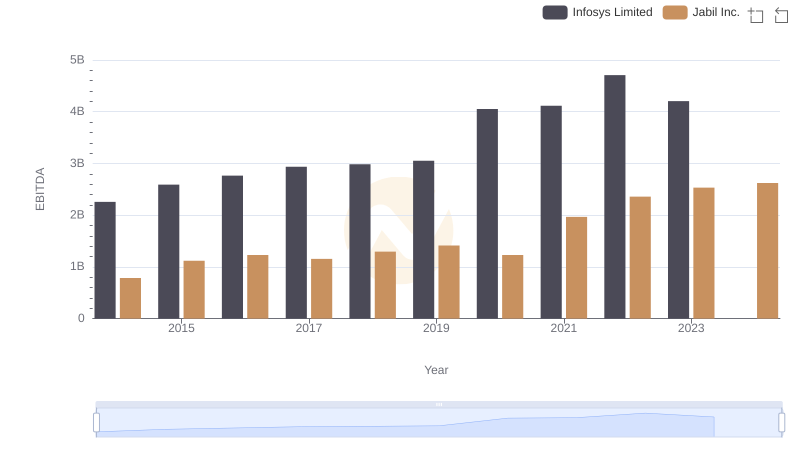
A Professional Review of EBITDA: Infosys Limited Compared to Jabil Inc.
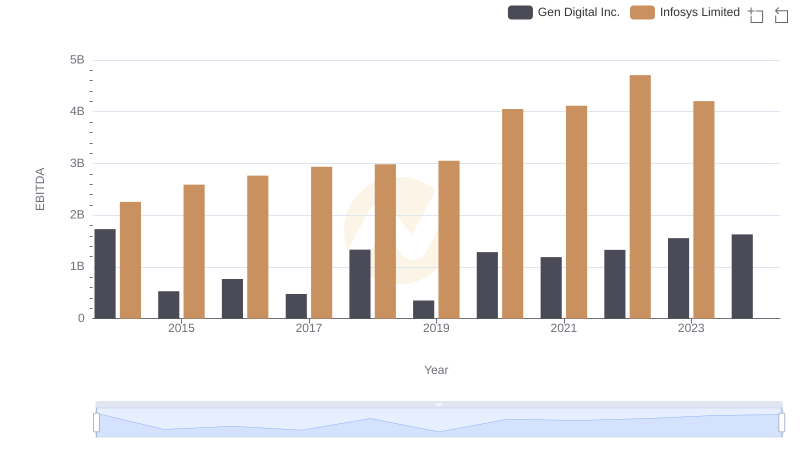
A Side-by-Side Analysis of EBITDA: Infosys Limited and Gen Digital Inc.
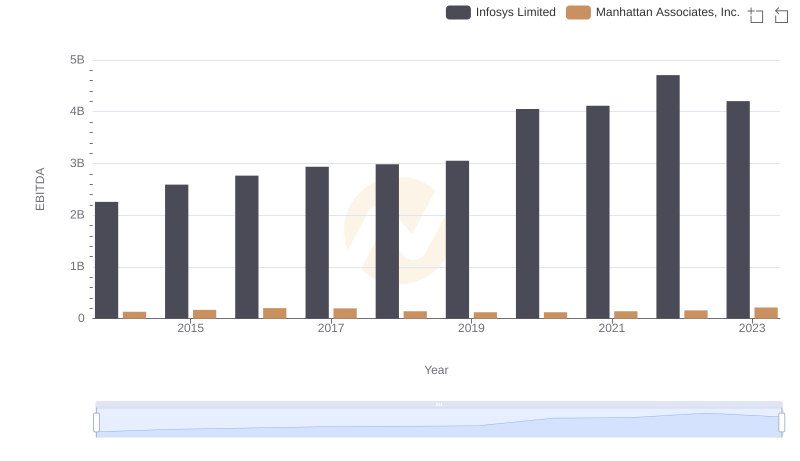
Comprehensive EBITDA Comparison: Infosys Limited vs Manhattan Associates, Inc.
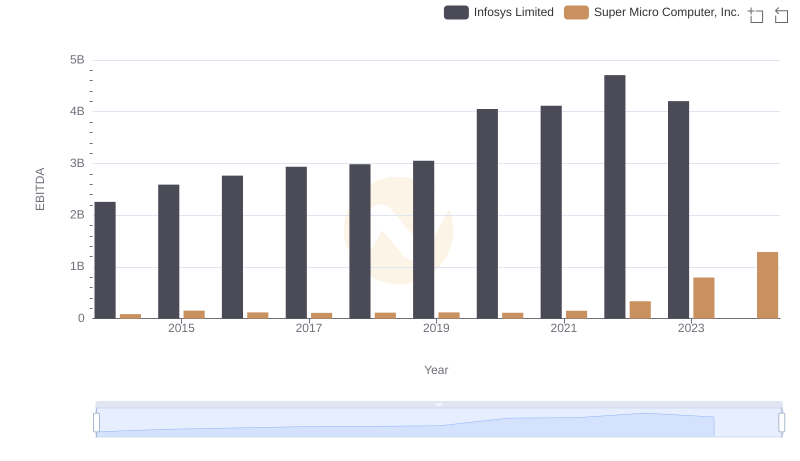
Professional EBITDA Benchmarking: Infosys Limited vs Super Micro Computer, Inc.