| __timestamp | Infosys Limited | Trimble Inc. |
|---|---|---|
| Wednesday, January 1, 2014 | 2258000000 | 476337000 |
| Thursday, January 1, 2015 | 2590000000 | 376200000 |
| Friday, January 1, 2016 | 2765000000 | 388300000 |
| Sunday, January 1, 2017 | 2936000000 | 478100000 |
| Monday, January 1, 2018 | 2984000000 | 590000000 |
| Tuesday, January 1, 2019 | 3053000000 | 656700000 |
| Wednesday, January 1, 2020 | 4053342784 | 692900000 |
| Friday, January 1, 2021 | 4116000000 | 845800000 |
| Saturday, January 1, 2022 | 4707334610 | 747400000 |
| Sunday, January 1, 2023 | 4206000000 | 768600000 |
In pursuit of knowledge
In the ever-evolving landscape of global business, understanding the financial health of companies is crucial. This analysis delves into the EBITDA performance of two industry giants: Infosys Limited, a leader in IT services, and Trimble Inc., a pioneer in technology solutions. From 2014 to 2023, Infosys consistently outperformed Trimble, with an average EBITDA nearly six times higher. Notably, Infosys saw a remarkable 86% growth in EBITDA, peaking in 2022, while Trimble experienced a steady increase of 62% over the same period. The year 2020 marked a significant leap for Infosys, with a 33% rise, reflecting its resilience during global economic challenges. Meanwhile, Trimble's EBITDA growth was more gradual, highlighting its steady expansion strategy. This side-by-side analysis offers valuable insights into the strategic financial maneuvers of these two companies over the past decade.
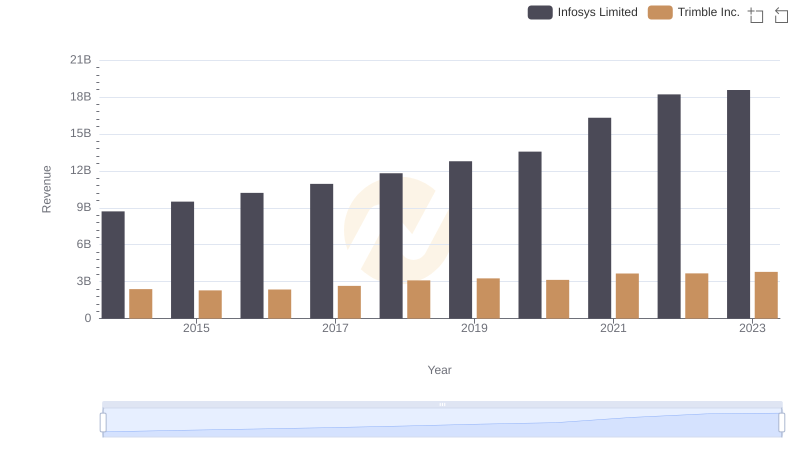
Revenue Showdown: Infosys Limited vs Trimble Inc.
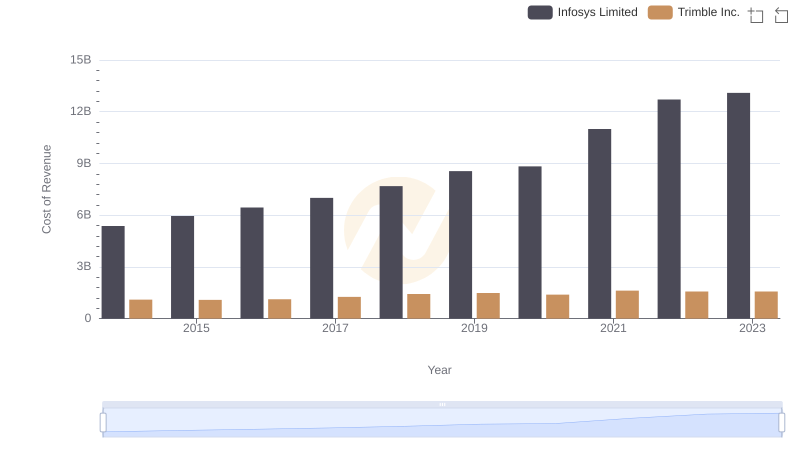
Infosys Limited vs Trimble Inc.: Efficiency in Cost of Revenue Explored

Key Insights on Gross Profit: Infosys Limited vs Trimble Inc.
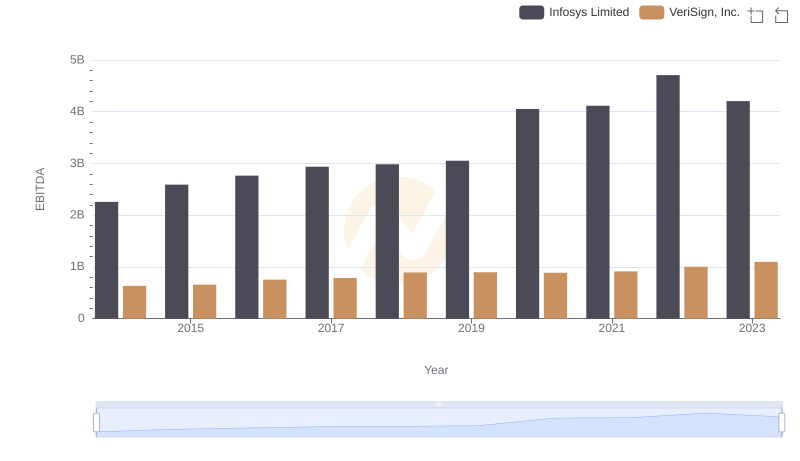
EBITDA Analysis: Evaluating Infosys Limited Against VeriSign, Inc.
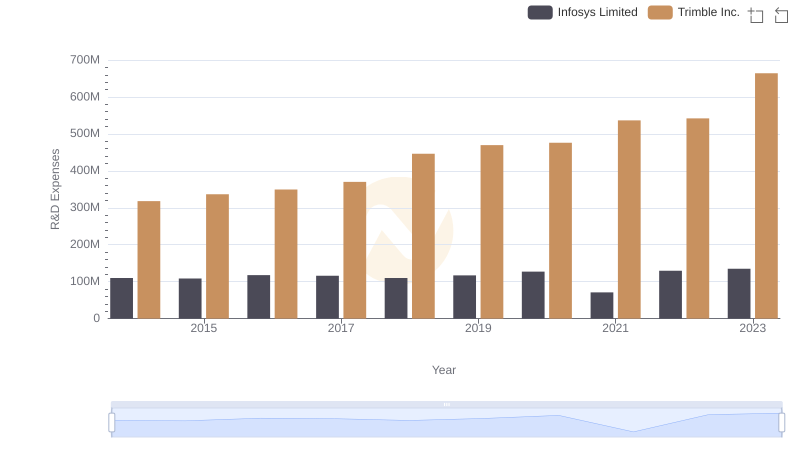
Research and Development Expenses Breakdown: Infosys Limited vs Trimble Inc.
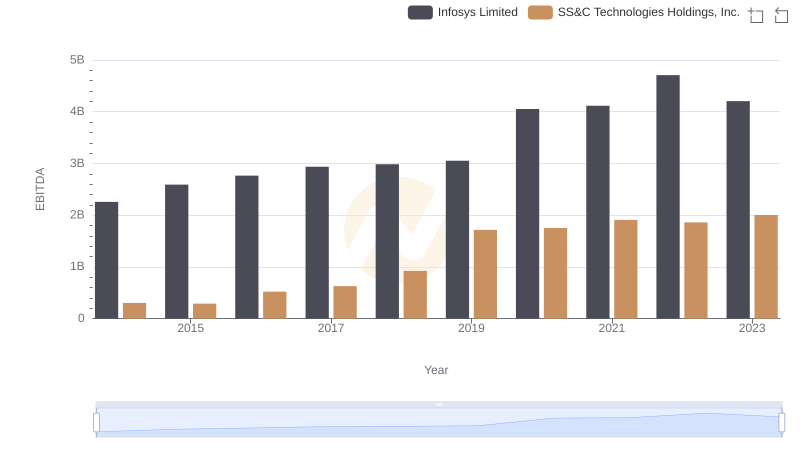
Comparative EBITDA Analysis: Infosys Limited vs SS&C Technologies Holdings, Inc.
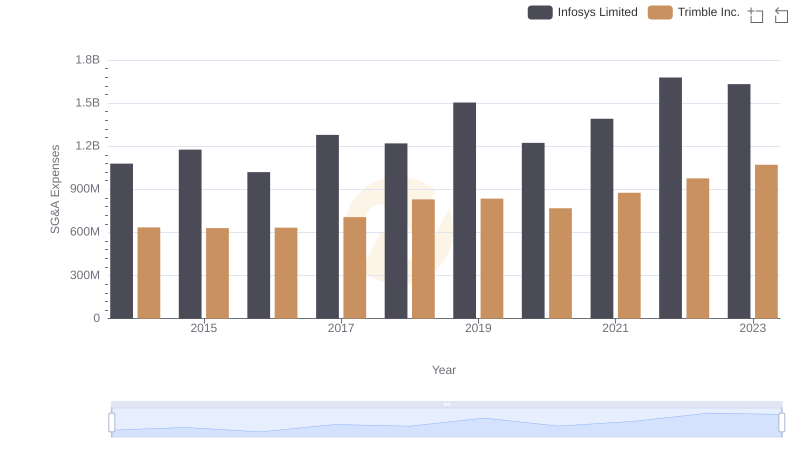
SG&A Efficiency Analysis: Comparing Infosys Limited and Trimble Inc.
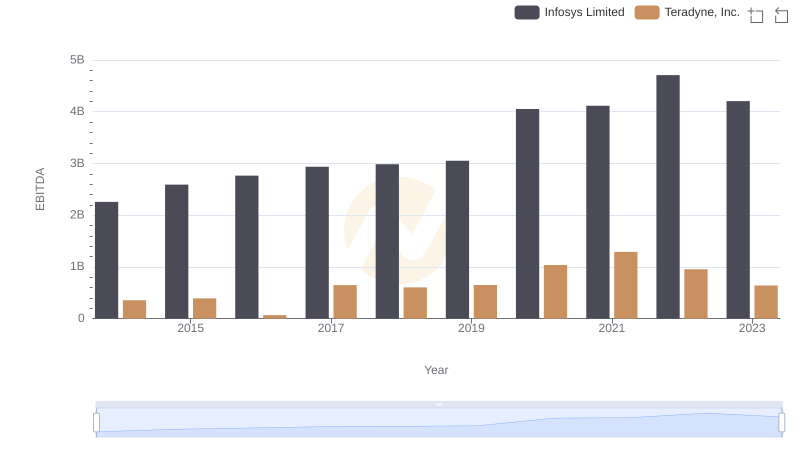
EBITDA Metrics Evaluated: Infosys Limited vs Teradyne, Inc.
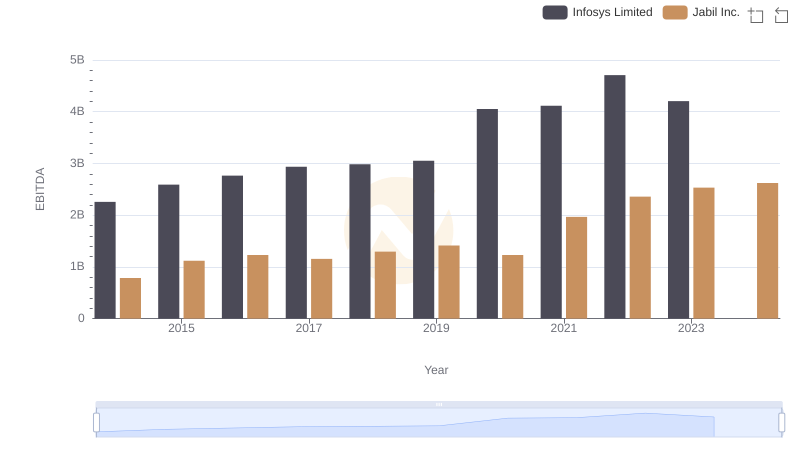
A Professional Review of EBITDA: Infosys Limited Compared to Jabil Inc.
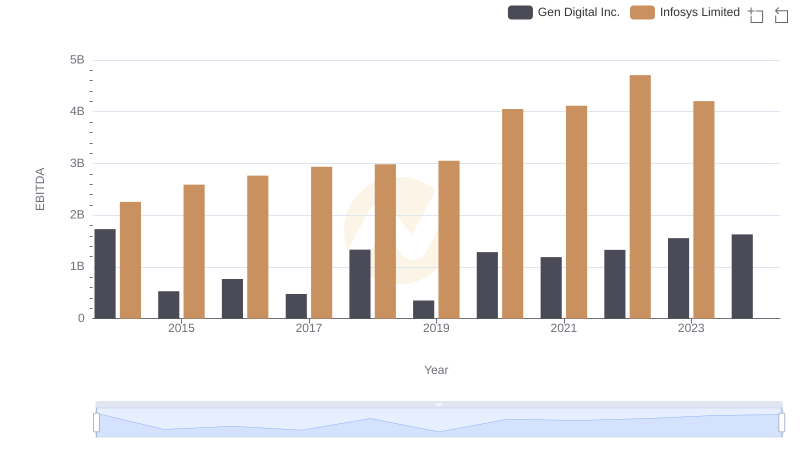
A Side-by-Side Analysis of EBITDA: Infosys Limited and Gen Digital Inc.
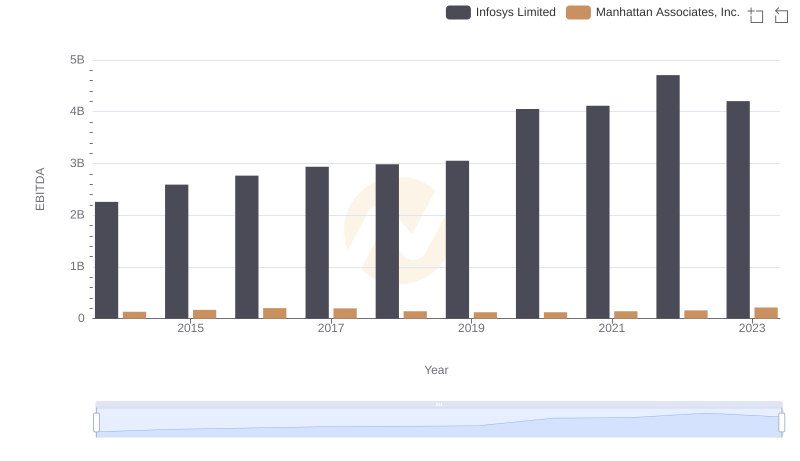
Comprehensive EBITDA Comparison: Infosys Limited vs Manhattan Associates, Inc.
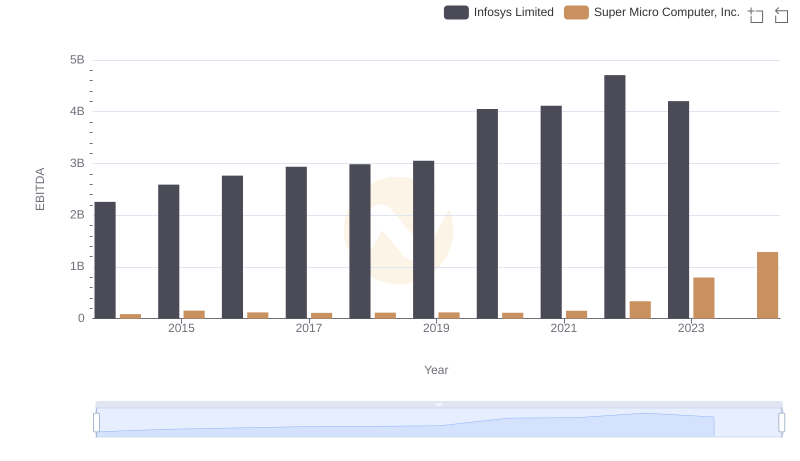
Professional EBITDA Benchmarking: Infosys Limited vs Super Micro Computer, Inc.