| __timestamp | Infosys Limited | SS&C Technologies Holdings, Inc. |
|---|---|---|
| Wednesday, January 1, 2014 | 2258000000 | 304662000 |
| Thursday, January 1, 2015 | 2590000000 | 291009000 |
| Friday, January 1, 2016 | 2765000000 | 522241000 |
| Sunday, January 1, 2017 | 2936000000 | 628500000 |
| Monday, January 1, 2018 | 2984000000 | 923700000 |
| Tuesday, January 1, 2019 | 3053000000 | 1716500000 |
| Wednesday, January 1, 2020 | 4053342784 | 1751000000 |
| Friday, January 1, 2021 | 4116000000 | 1910100000 |
| Saturday, January 1, 2022 | 4707334610 | 1859800000 |
| Sunday, January 1, 2023 | 4206000000 | 2004400000 |
| Monday, January 1, 2024 | 1343500000 |
In pursuit of knowledge
In the ever-evolving landscape of global technology, Infosys Limited and SS&C Technologies Holdings, Inc. have emerged as key players. Over the past decade, from 2014 to 2023, these companies have demonstrated significant growth in their EBITDA, a crucial indicator of financial health and operational efficiency.
Infosys has shown a remarkable upward trajectory, with its EBITDA growing by approximately 86% over the period. Starting at 2.3 billion in 2014, it peaked at 4.7 billion in 2022, reflecting its robust business model and strategic expansions.
SS&C Technologies, while starting from a smaller base, has experienced a staggering 556% increase in EBITDA, from 305 million in 2014 to 2 billion in 2023. This growth underscores its aggressive acquisition strategy and market adaptability.
Both companies exemplify resilience and innovation, setting benchmarks in the tech industry.
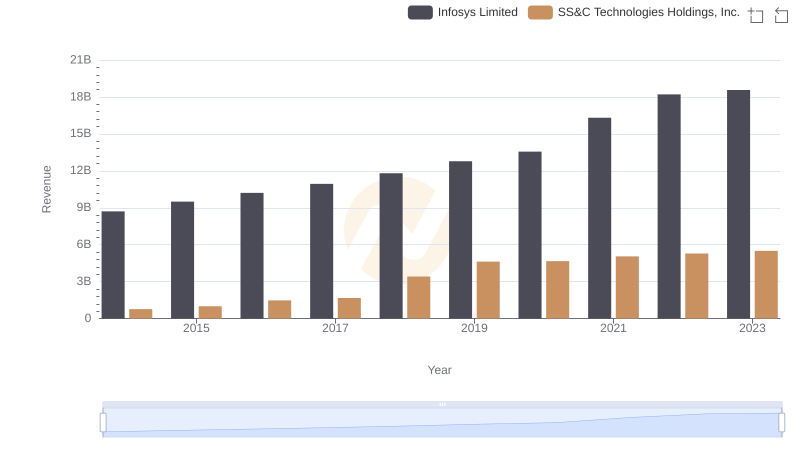
Infosys Limited vs SS&C Technologies Holdings, Inc.: Examining Key Revenue Metrics
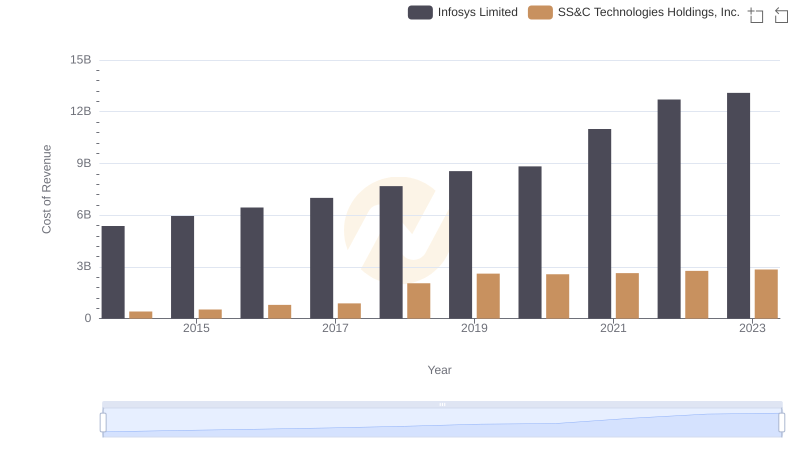
Cost of Revenue Comparison: Infosys Limited vs SS&C Technologies Holdings, Inc.
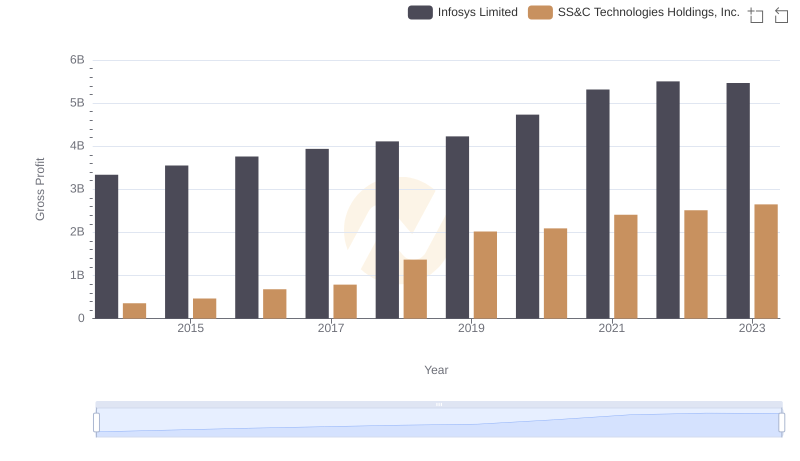
Gross Profit Comparison: Infosys Limited and SS&C Technologies Holdings, Inc. Trends
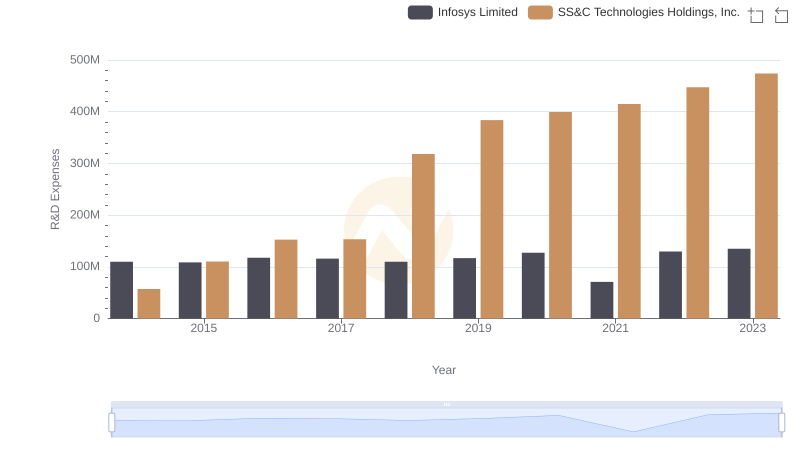
R&D Spending Showdown: Infosys Limited vs SS&C Technologies Holdings, Inc.
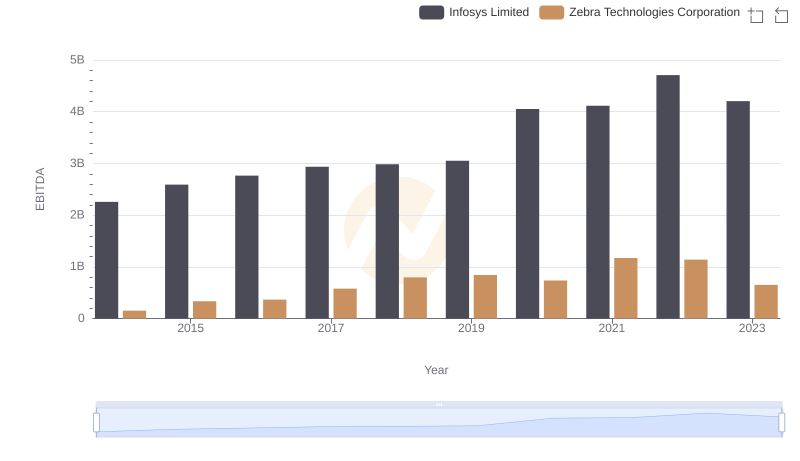
Comprehensive EBITDA Comparison: Infosys Limited vs Zebra Technologies Corporation
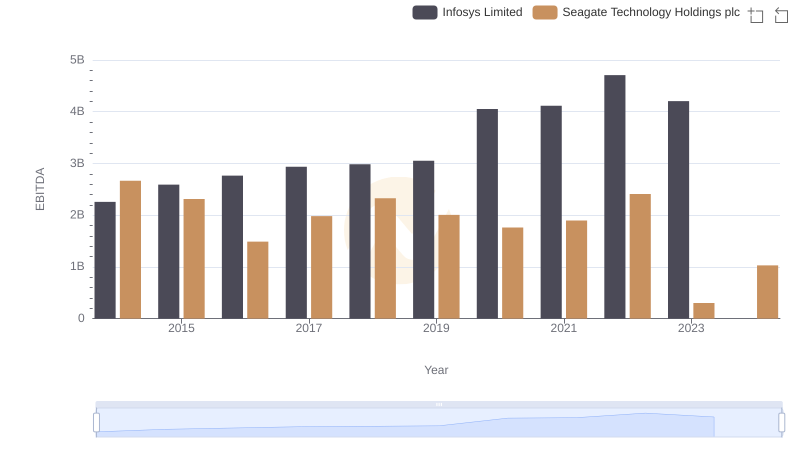
Comparative EBITDA Analysis: Infosys Limited vs Seagate Technology Holdings plc
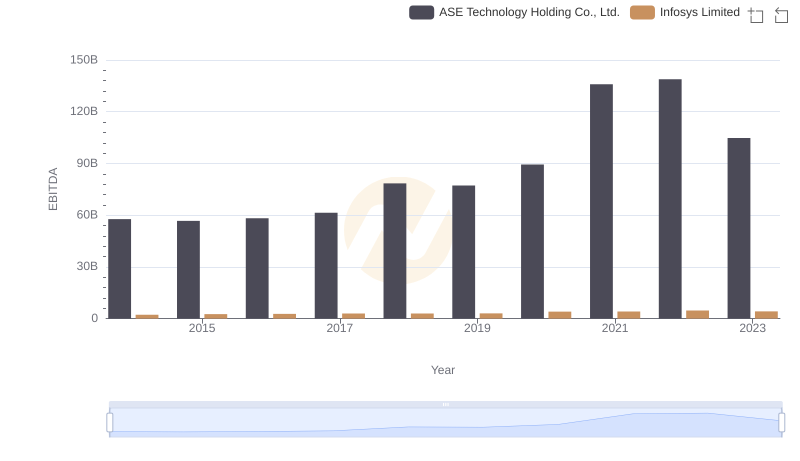
Infosys Limited and ASE Technology Holding Co., Ltd.: A Detailed Examination of EBITDA Performance
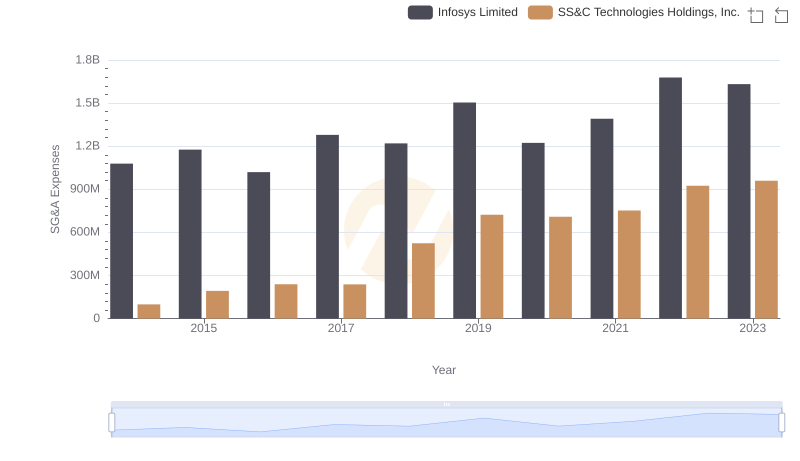
Breaking Down SG&A Expenses: Infosys Limited vs SS&C Technologies Holdings, Inc.
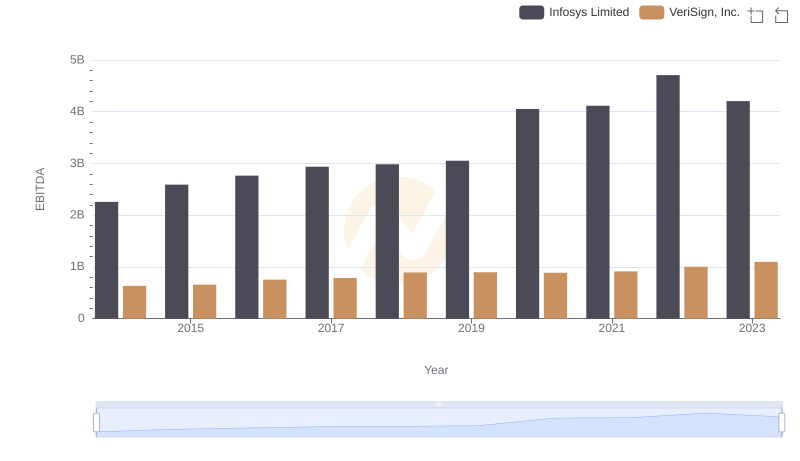
EBITDA Analysis: Evaluating Infosys Limited Against VeriSign, Inc.
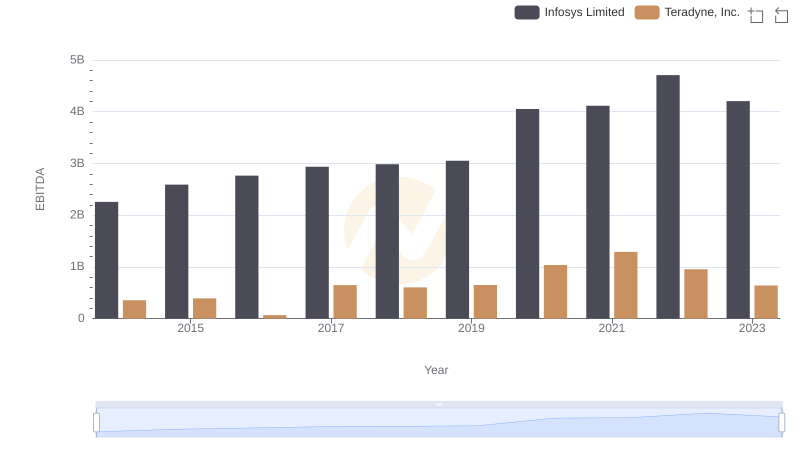
EBITDA Metrics Evaluated: Infosys Limited vs Teradyne, Inc.
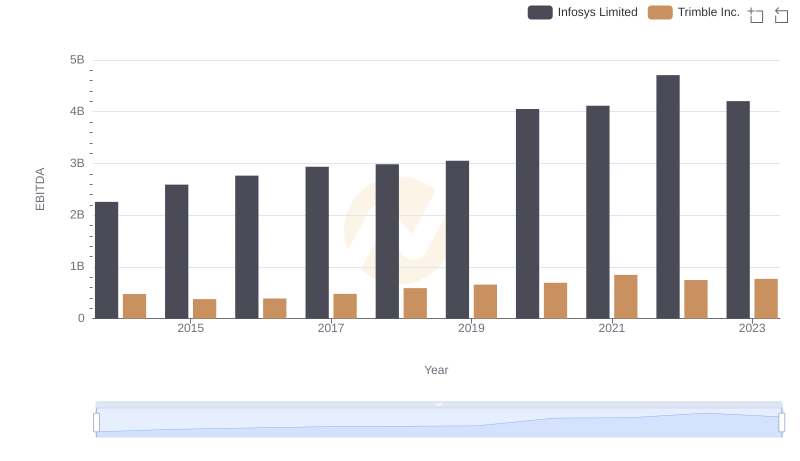
A Side-by-Side Analysis of EBITDA: Infosys Limited and Trimble Inc.
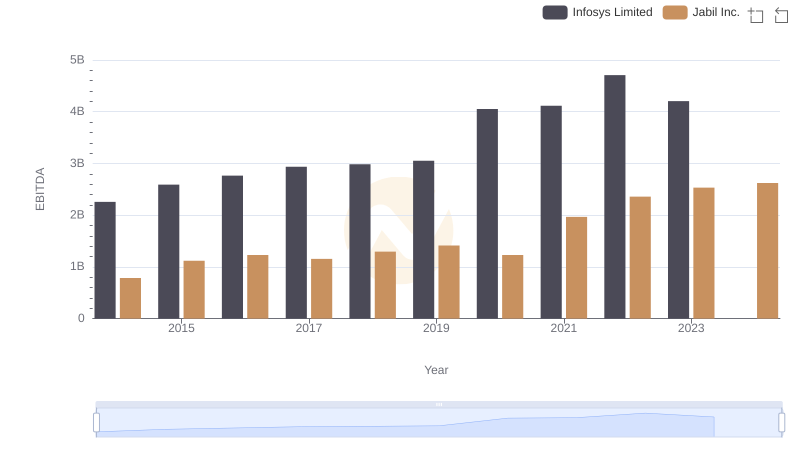
A Professional Review of EBITDA: Infosys Limited Compared to Jabil Inc.