| __timestamp | Infosys Limited | Manhattan Associates, Inc. |
|---|---|---|
| Wednesday, January 1, 2014 | 2258000000 | 133501000 |
| Thursday, January 1, 2015 | 2590000000 | 169210000 |
| Friday, January 1, 2016 | 2765000000 | 203397000 |
| Sunday, January 1, 2017 | 2936000000 | 197626000 |
| Monday, January 1, 2018 | 2984000000 | 142500000 |
| Tuesday, January 1, 2019 | 3053000000 | 123911000 |
| Wednesday, January 1, 2020 | 4053342784 | 123007000 |
| Friday, January 1, 2021 | 4116000000 | 142247000 |
| Saturday, January 1, 2022 | 4707334610 | 159363000 |
| Sunday, January 1, 2023 | 4206000000 | 215633000 |
| Monday, January 1, 2024 | 267897000 |
In pursuit of knowledge
In the ever-evolving landscape of the technology and consulting sectors, understanding a company's financial health is crucial for investors and stakeholders alike. Earnings Before Interest, Taxes, Depreciation, and Amortization (EBITDA) serves as a vital indicator of a company's operational performance, allowing for a clearer comparison between firms. This article delves into the EBITDA performance of two prominent players in the industry: Infosys Limited and Manhattan Associates, Inc. over the past decade.
Infosys Limited, founded in 1981 in India, has grown into one of the largest IT services companies globally, known for its innovative solutions and robust client base. Over the years, Infosys has consistently demonstrated impressive financial growth, with its EBITDA figures reflecting a substantial upward trend. In stark contrast, Manhattan Associates, established in 1990 in the United States, specializes in supply chain and omnichannel commerce solutions. While smaller in scale, Manhattan Associates has carved out a niche in its market, showcasing steady growth.
From 2014 to 2023, Infosys Limited exhibited a remarkable increase in EBITDA, starting at approximately $2.26 billion in 2014 and peaking at around $4.71 billion in 2022. This represents an impressive growth rate of nearly 108% over the decade. The company's EBITDA growth trajectory illustrates its ability to scale operations and enhance profitability, reflecting a compound annual growth rate (CAGR) of about 10.5%.
Conversely, Manhattan Associates reported a more modest EBITDA growth, beginning at about $133.5 million in 2014 and reaching approximately $215.6 million by 2023. This translates to a growth of roughly 61% over the same period, with a CAGR of approximately 6.1%. While this growth is commendable, it underscores the challenges faced by Manhattan Associates in scaling its operations relative to its larger competitor.
Analyzing year-on-year performance, Infosys consistently outperformed Manhattan Associates in EBITDA figures. For instance, in 2020, Infosys recorded an EBITDA of over $4.05 billion, a significant leap from previous years, while Manhattan Associates struggled to surpass $123 million. This stark contrast highlights the operational efficiencies and market advantages enjoyed by Infosys.
Interestingly, both companies experienced fluctuations in their EBITDA during the pandemic years, reflecting the broader market volatility. However, Infosys demonstrated resilience, bouncing back to achieve its highest EBITDA in 2022, while Manhattan Associates showed a slower recovery.
The comparative analysis of EBITDA between Infosys Limited and Manhattan Associates, Inc. reveals a compelling narrative of growth, resilience, and market dynamics. While Infosys continues to dominate with its robust financial performance, Manhattan Associates remains a noteworthy player in its niche, showcasing steady growth. Investors and stakeholders should consider these insights when evaluating potential opportunities in the tech and consulting sectors, as the financial health of these companies will undoubtedly shape their future trajectories.
In conclusion, the financial data underscores the importance of EBITDA as a key metric for assessing operational success and market competitiveness. As both companies continue to navigate the complexities of their respective industries, their future performance will be pivotal in shaping investor confidence and market trends.
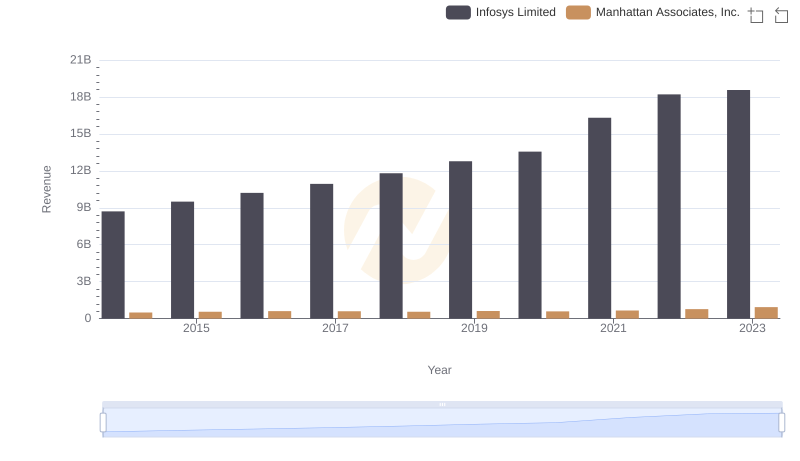
Annual Revenue Comparison: Infosys Limited vs Manhattan Associates, Inc.
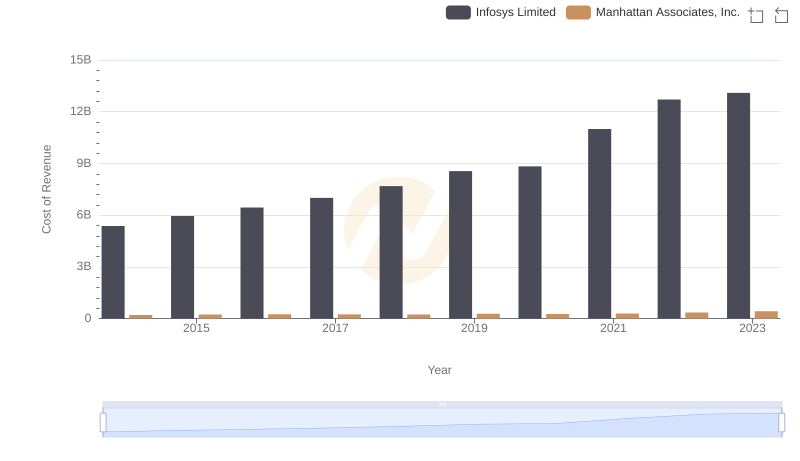
Cost of Revenue Trends: Infosys Limited vs Manhattan Associates, Inc.
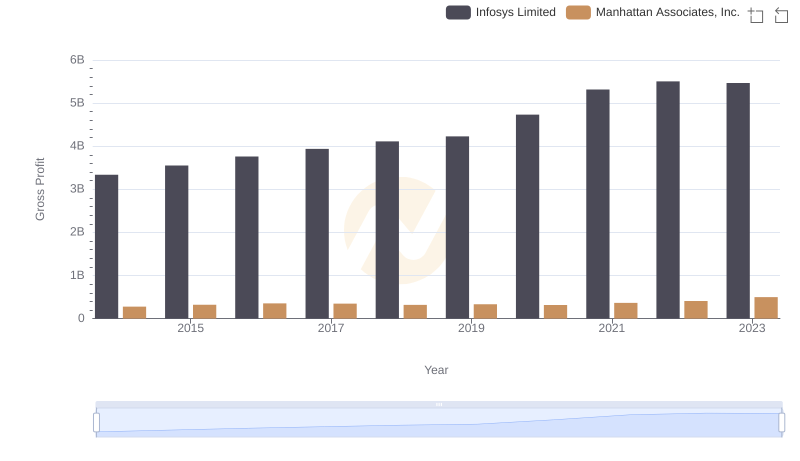
Who Generates Higher Gross Profit? Infosys Limited or Manhattan Associates, Inc.
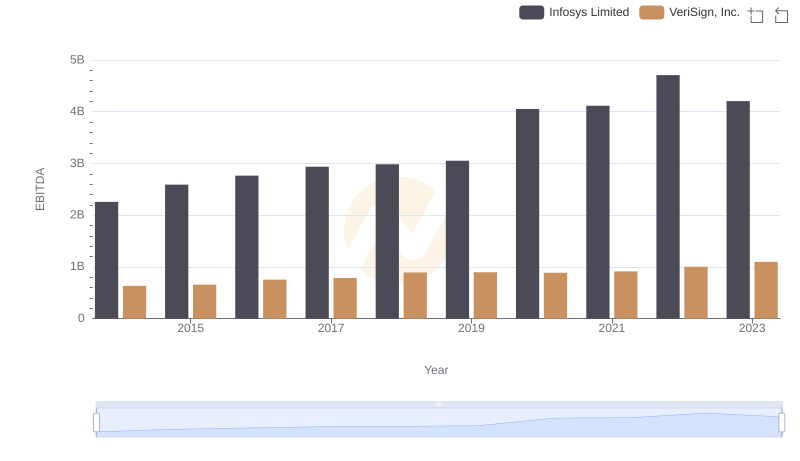
EBITDA Analysis: Evaluating Infosys Limited Against VeriSign, Inc.
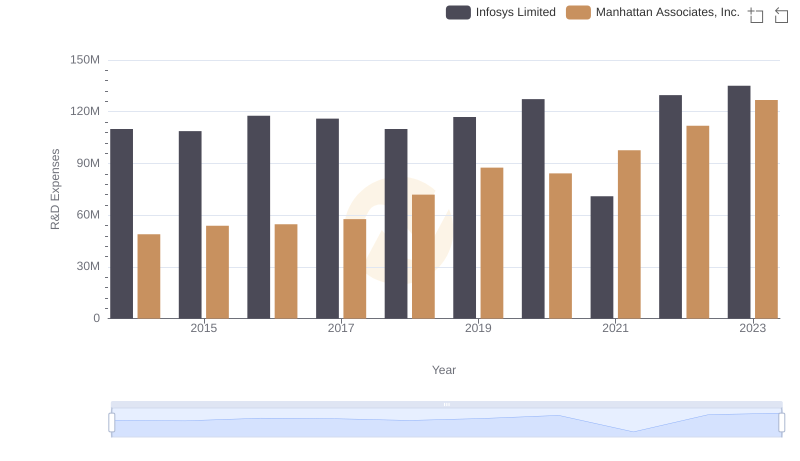
Who Prioritizes Innovation? R&D Spending Compared for Infosys Limited and Manhattan Associates, Inc.
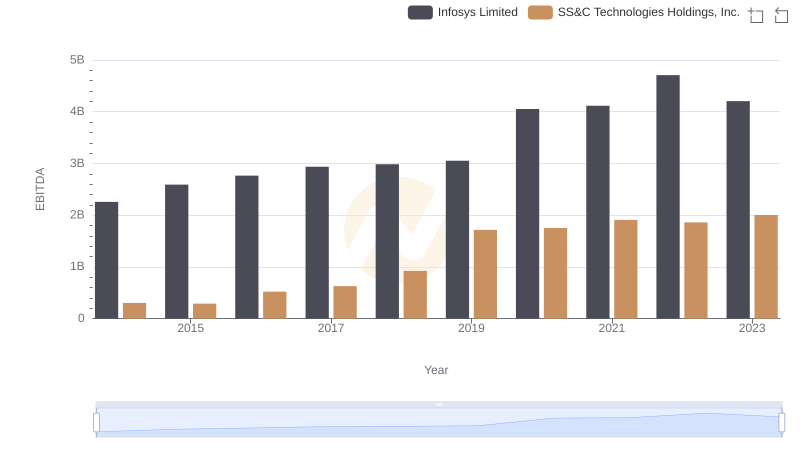
Comparative EBITDA Analysis: Infosys Limited vs SS&C Technologies Holdings, Inc.
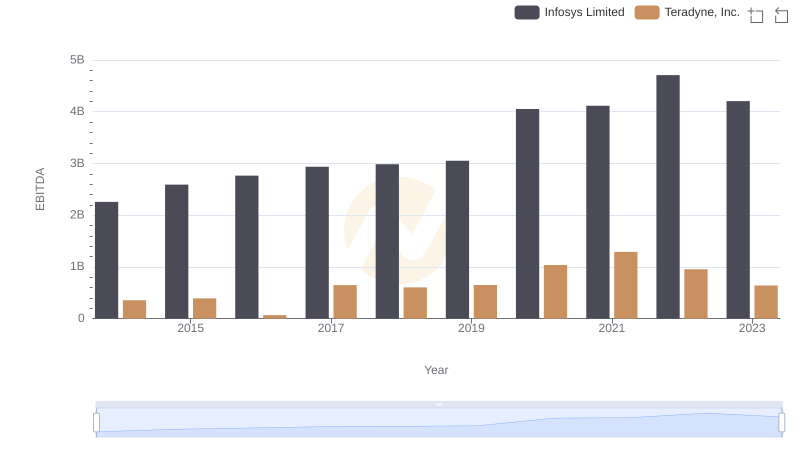
EBITDA Metrics Evaluated: Infosys Limited vs Teradyne, Inc.
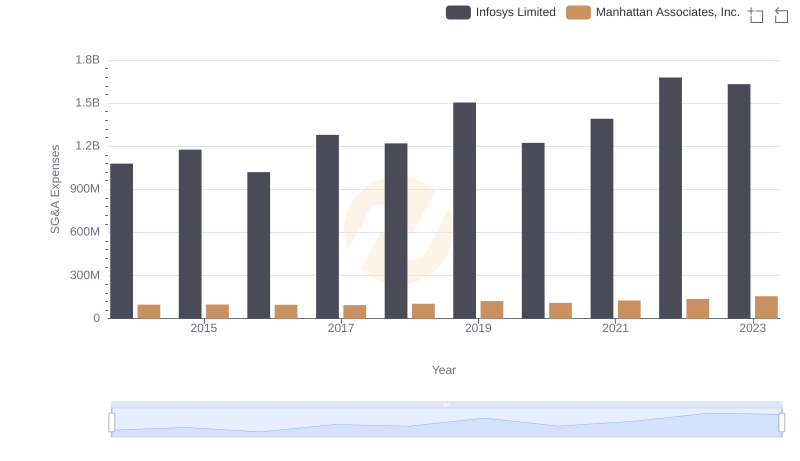
Who Optimizes SG&A Costs Better? Infosys Limited or Manhattan Associates, Inc.
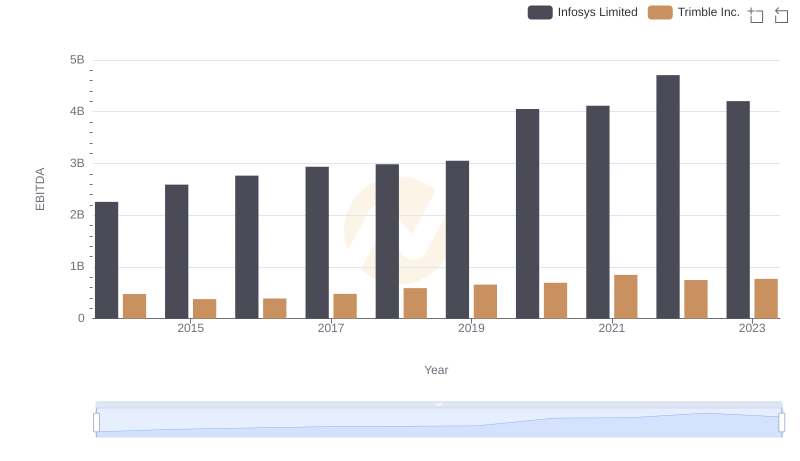
A Side-by-Side Analysis of EBITDA: Infosys Limited and Trimble Inc.
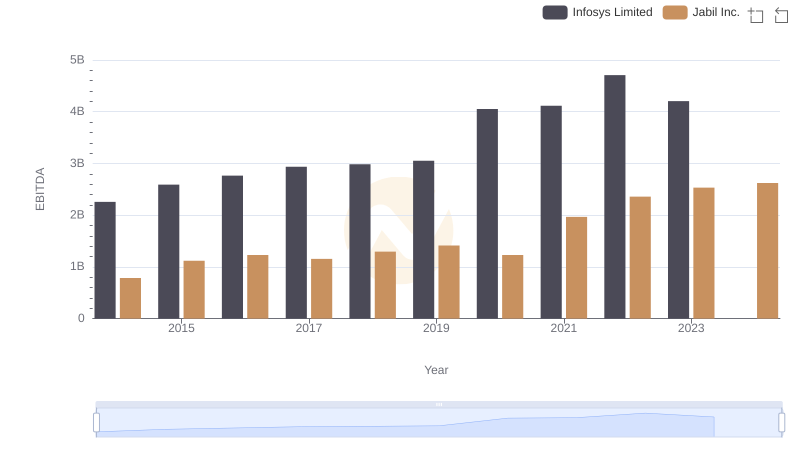
A Professional Review of EBITDA: Infosys Limited Compared to Jabil Inc.
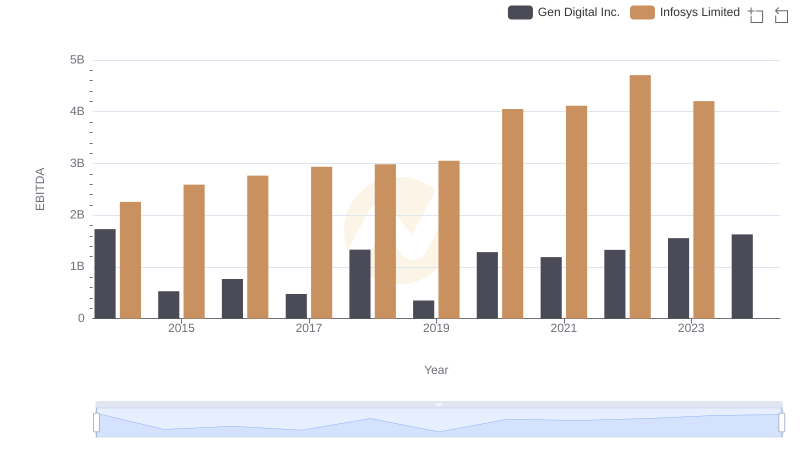
A Side-by-Side Analysis of EBITDA: Infosys Limited and Gen Digital Inc.
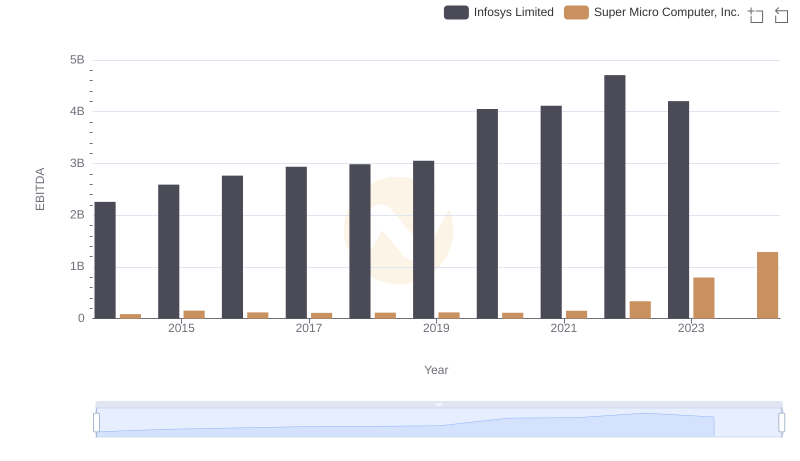
Professional EBITDA Benchmarking: Infosys Limited vs Super Micro Computer, Inc.