| __timestamp | Infosys Limited | Teradyne, Inc. |
|---|---|---|
| Wednesday, January 1, 2014 | 5374000000 | 769016000 |
| Thursday, January 1, 2015 | 5950000000 | 723935000 |
| Friday, January 1, 2016 | 6446000000 | 793683000 |
| Sunday, January 1, 2017 | 7001000000 | 912734000 |
| Monday, January 1, 2018 | 7687000000 | 880408000 |
| Tuesday, January 1, 2019 | 8552000000 | 955136000 |
| Wednesday, January 1, 2020 | 8828000000 | 1335728000 |
| Friday, January 1, 2021 | 10996000000 | 1496225000 |
| Saturday, January 1, 2022 | 12709000000 | 1287894000 |
| Sunday, January 1, 2023 | 13096000000 | 1139550000 |
| Monday, January 1, 2024 | 1170953000 |
Unlocking the unknown
In the ever-evolving landscape of global technology, understanding the cost dynamics of industry giants is crucial. From 2014 to 2023, Infosys Limited and Teradyne, Inc. have showcased intriguing trends in their cost of revenue. Infosys, a leader in IT services, has seen its cost of revenue grow by approximately 144%, reflecting its expanding operations and market reach. In contrast, Teradyne, a key player in the semiconductor industry, experienced a more modest increase of around 48% over the same period.
The data reveals that Infosys consistently outpaces Teradyne in terms of cost, with 2023 figures showing Infosys at nearly 12 times the cost of Teradyne. This disparity highlights the scale and scope of Infosys's operations compared to Teradyne's more niche focus. As the tech industry continues to grow, these insights provide a window into the strategic financial maneuvers of these two influential companies.
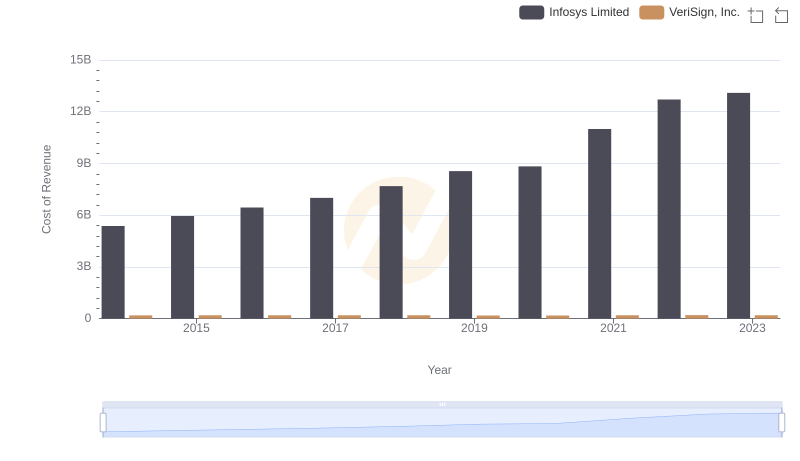
Cost of Revenue: Key Insights for Infosys Limited and VeriSign, Inc.
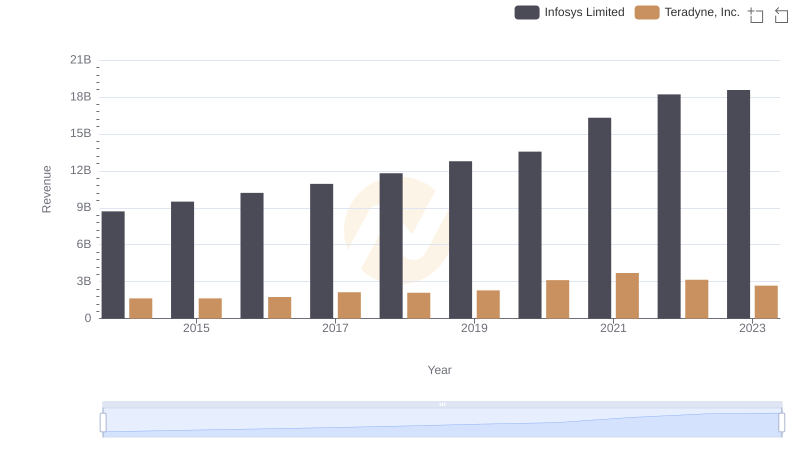
Who Generates More Revenue? Infosys Limited or Teradyne, Inc.
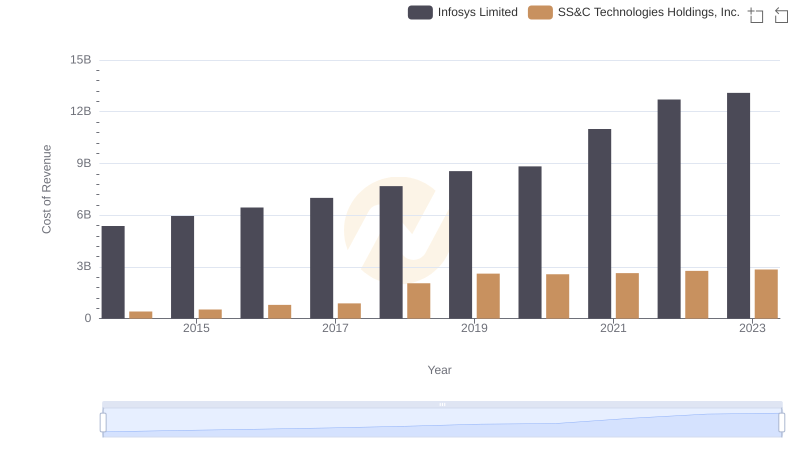
Cost of Revenue Comparison: Infosys Limited vs SS&C Technologies Holdings, Inc.
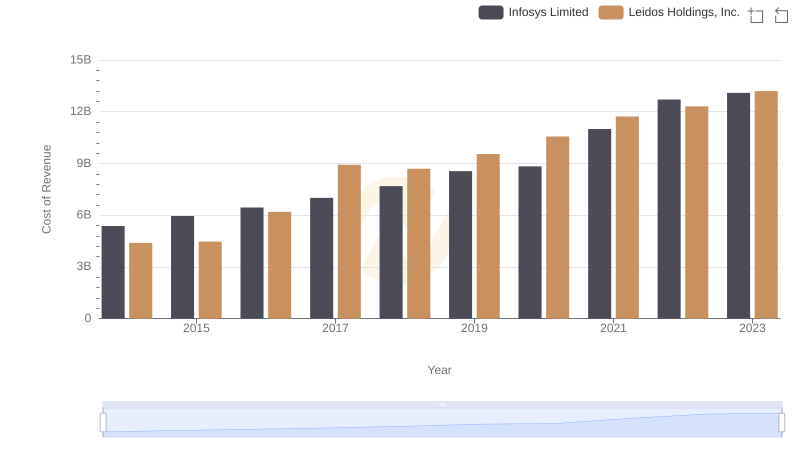
Cost of Revenue: Key Insights for Infosys Limited and Leidos Holdings, Inc.
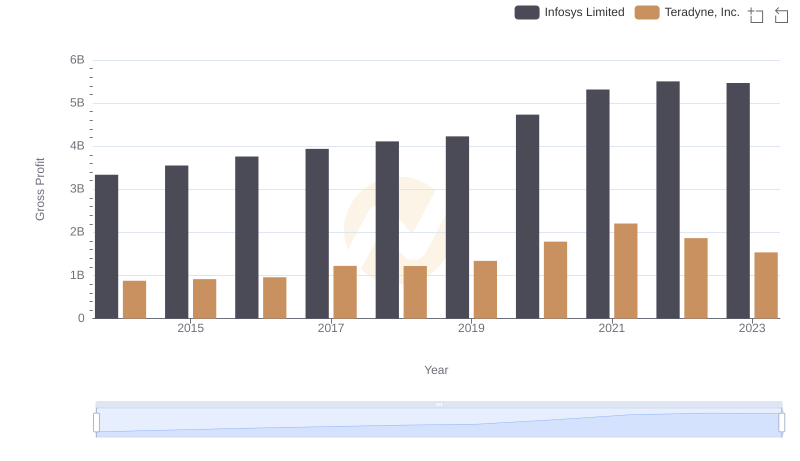
Infosys Limited vs Teradyne, Inc.: A Gross Profit Performance Breakdown
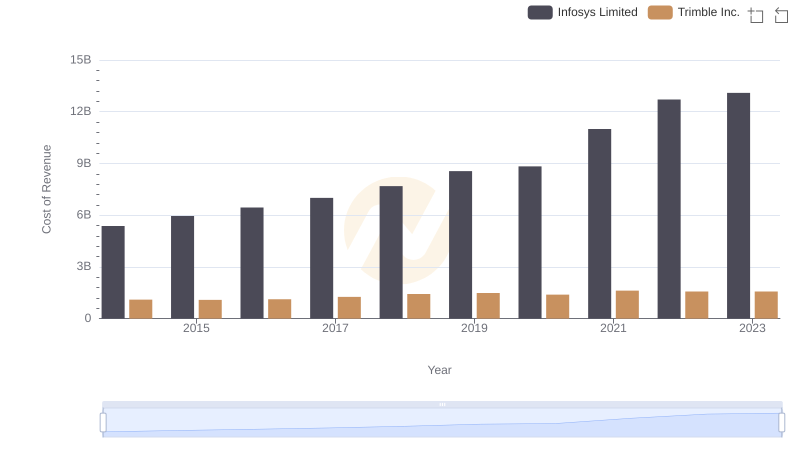
Infosys Limited vs Trimble Inc.: Efficiency in Cost of Revenue Explored
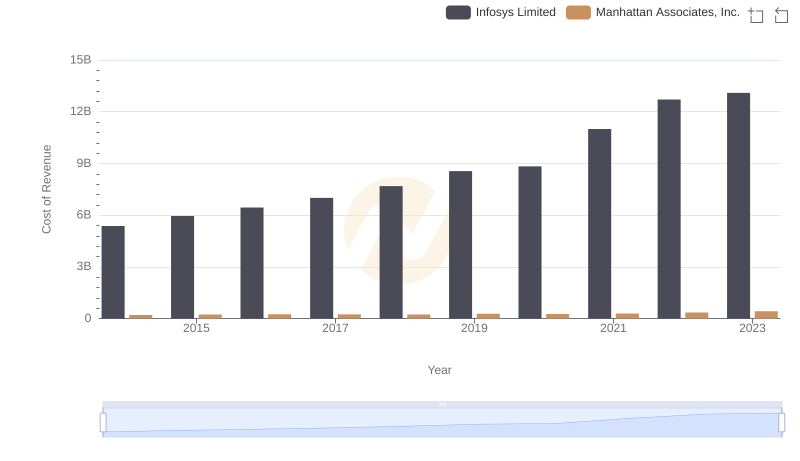
Cost of Revenue Trends: Infosys Limited vs Manhattan Associates, Inc.
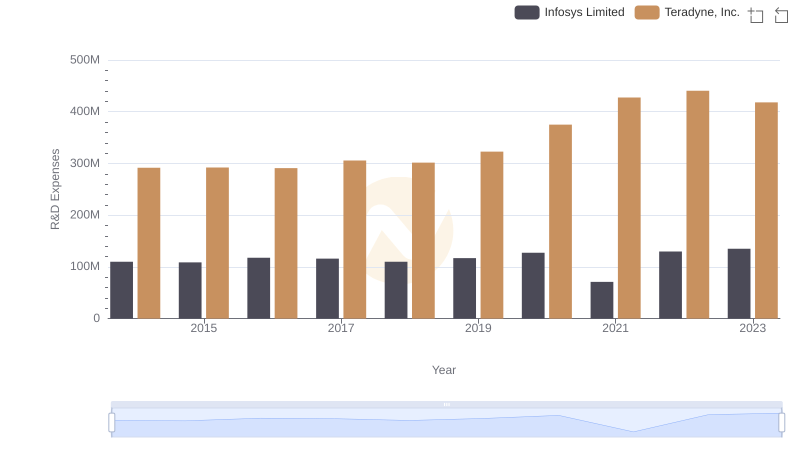
Who Prioritizes Innovation? R&D Spending Compared for Infosys Limited and Teradyne, Inc.
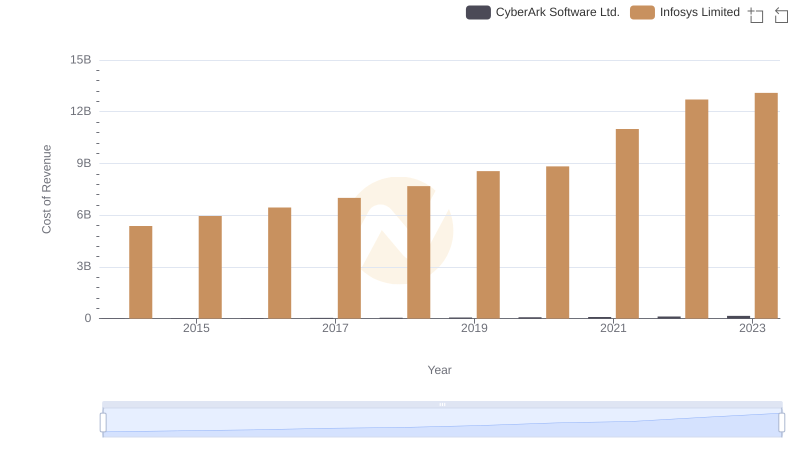
Cost of Revenue: Key Insights for Infosys Limited and CyberArk Software Ltd.
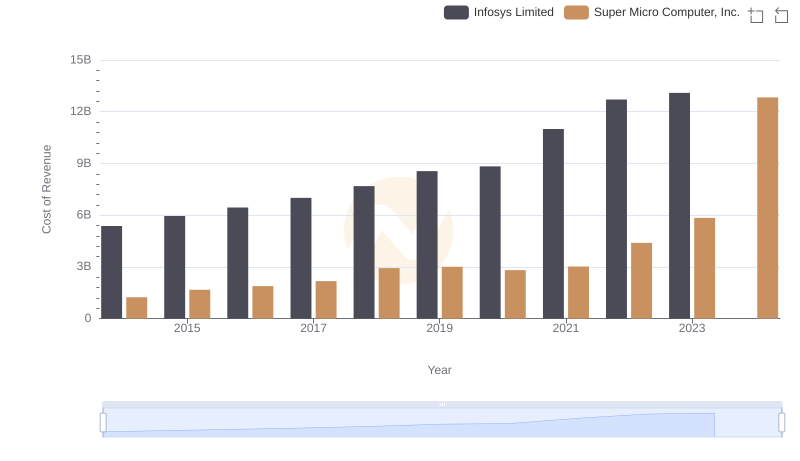
Cost Insights: Breaking Down Infosys Limited and Super Micro Computer, Inc.'s Expenses

Breaking Down SG&A Expenses: Infosys Limited vs Teradyne, Inc.
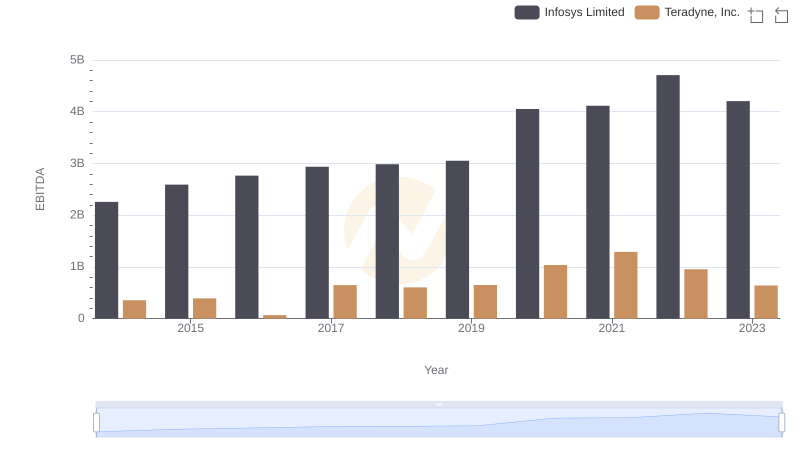
EBITDA Metrics Evaluated: Infosys Limited vs Teradyne, Inc.