| __timestamp | Gen Digital Inc. | Infosys Limited |
|---|---|---|
| Wednesday, January 1, 2014 | 1731000000 | 2258000000 |
| Thursday, January 1, 2015 | 530000000 | 2590000000 |
| Friday, January 1, 2016 | 766000000 | 2765000000 |
| Sunday, January 1, 2017 | 476000000 | 2936000000 |
| Monday, January 1, 2018 | 1333000000 | 2984000000 |
| Tuesday, January 1, 2019 | 350000000 | 3053000000 |
| Wednesday, January 1, 2020 | 1286000000 | 4053342784 |
| Friday, January 1, 2021 | 1188000000 | 4116000000 |
| Saturday, January 1, 2022 | 1328000000 | 4707334610 |
| Sunday, January 1, 2023 | 1557000000 | 4206000000 |
| Monday, January 1, 2024 | 1629000000 |
Unleashing insights
In the ever-evolving landscape of global technology, understanding financial health is crucial. This analysis delves into the EBITDA performance of two tech giants: Infosys Limited and Gen Digital Inc., from 2014 to 2023.
Infosys Limited has shown a robust upward trajectory, with EBITDA growing by approximately 86% over the decade. Starting at 2.26 billion in 2014, it peaked at 4.71 billion in 2022, reflecting its strong market position and strategic growth initiatives.
In contrast, Gen Digital Inc. experienced a more volatile journey. Its EBITDA fluctuated significantly, with a notable dip in 2019, but rebounded to 1.63 billion by 2023. This variability highlights the challenges and opportunities in the digital sector.
While Infosys demonstrates consistent growth, Gen Digital's performance underscores the dynamic nature of the tech industry. Missing data for Infosys in 2024 suggests ongoing developments worth monitoring.
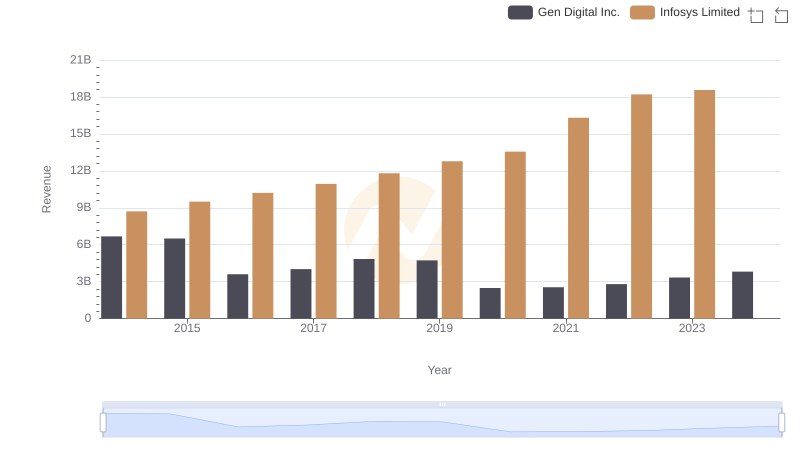
Annual Revenue Comparison: Infosys Limited vs Gen Digital Inc.
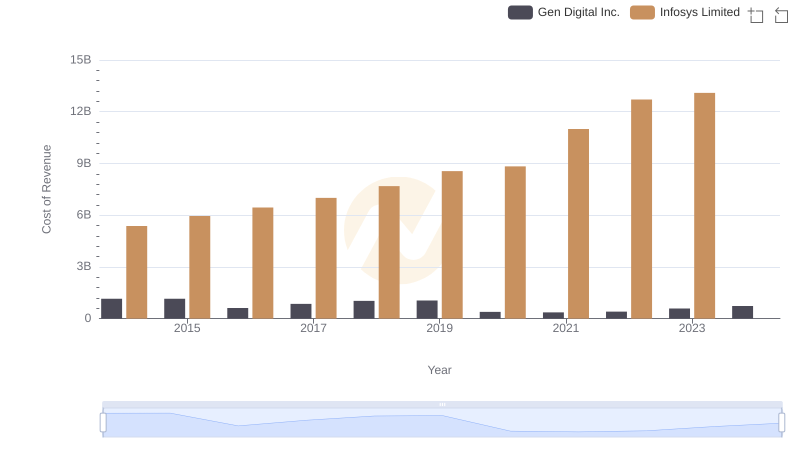
Cost of Revenue Trends: Infosys Limited vs Gen Digital Inc.
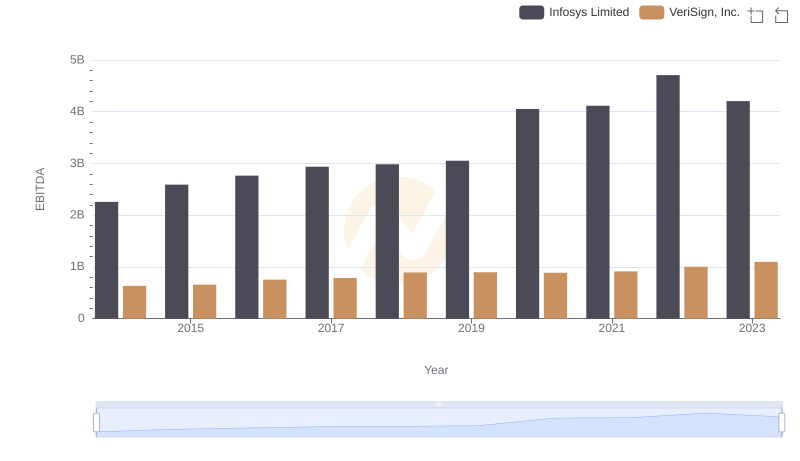
EBITDA Analysis: Evaluating Infosys Limited Against VeriSign, Inc.
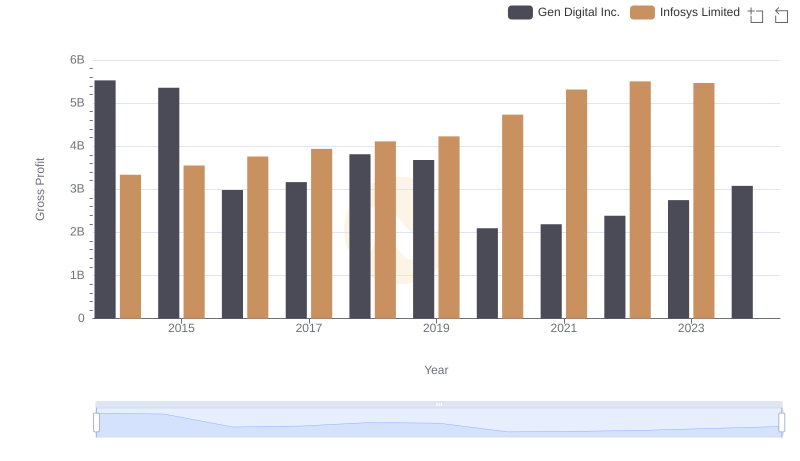
Infosys Limited vs Gen Digital Inc.: A Gross Profit Performance Breakdown
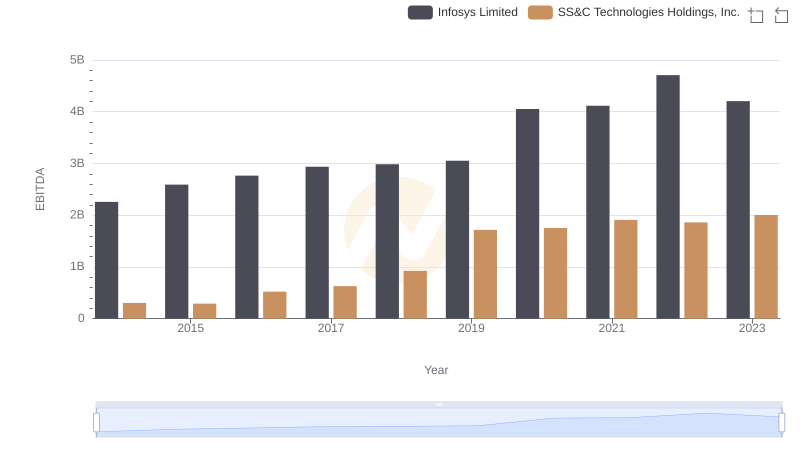
Comparative EBITDA Analysis: Infosys Limited vs SS&C Technologies Holdings, Inc.
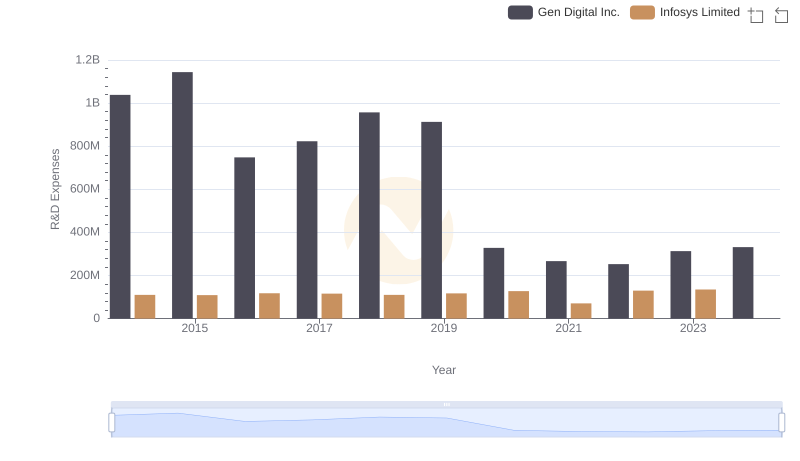
Comparing Innovation Spending: Infosys Limited and Gen Digital Inc.
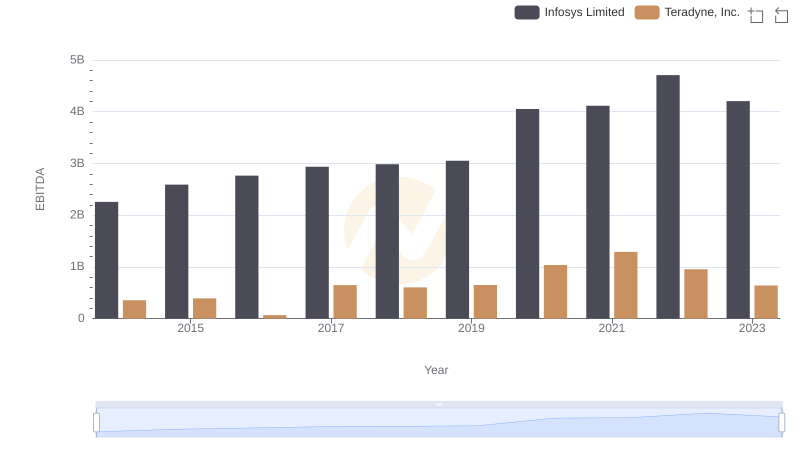
EBITDA Metrics Evaluated: Infosys Limited vs Teradyne, Inc.
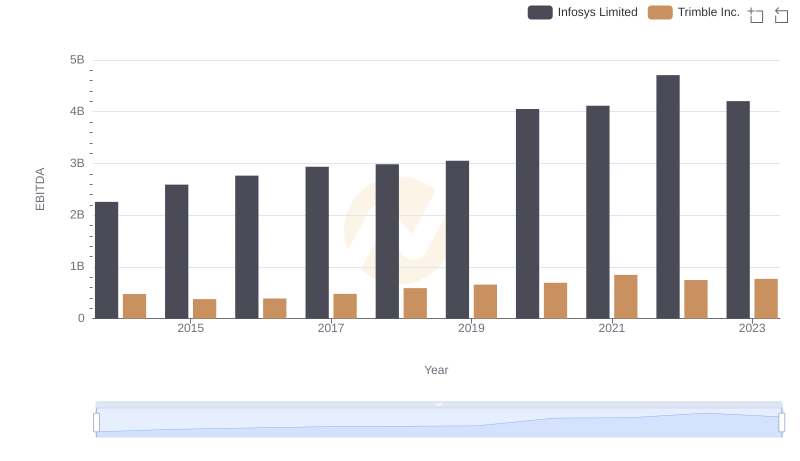
A Side-by-Side Analysis of EBITDA: Infosys Limited and Trimble Inc.
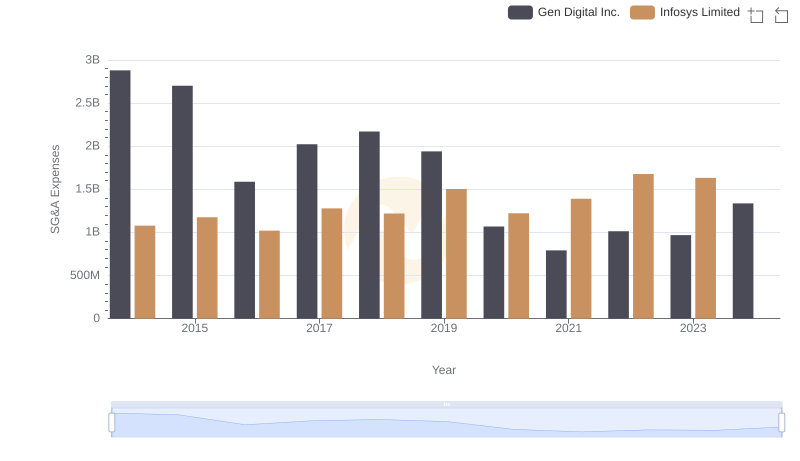
Who Optimizes SG&A Costs Better? Infosys Limited or Gen Digital Inc.
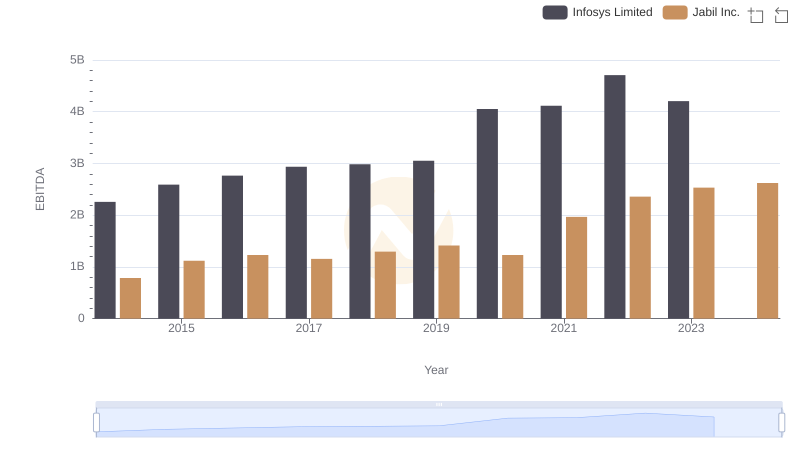
A Professional Review of EBITDA: Infosys Limited Compared to Jabil Inc.
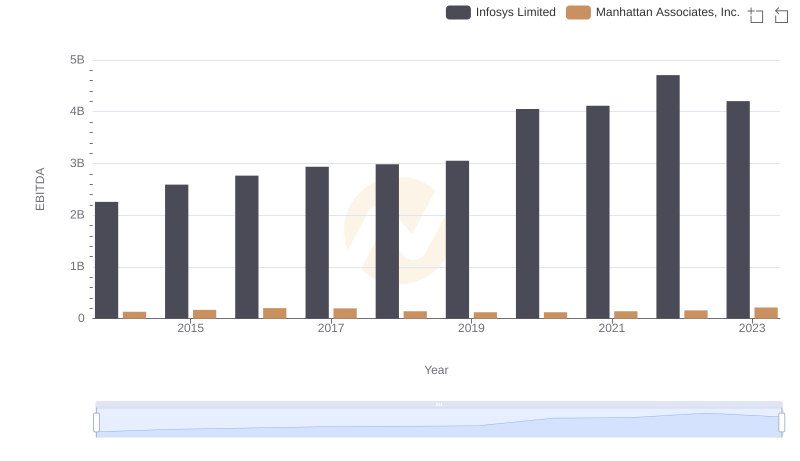
Comprehensive EBITDA Comparison: Infosys Limited vs Manhattan Associates, Inc.
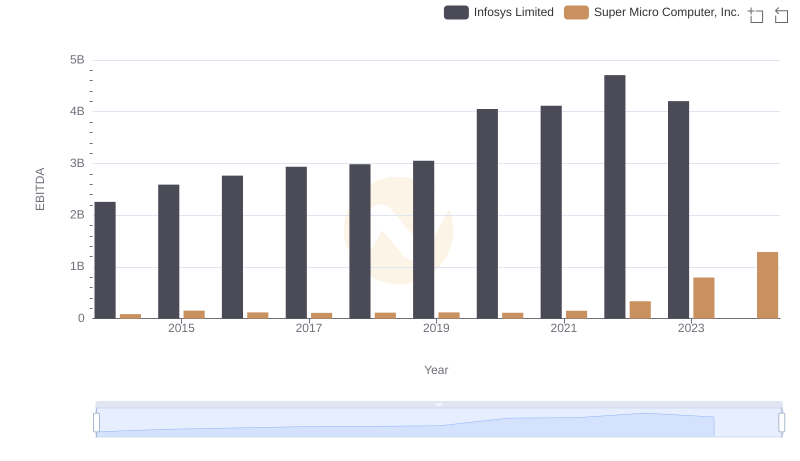
Professional EBITDA Benchmarking: Infosys Limited vs Super Micro Computer, Inc.