| __timestamp | Global Payments Inc. | Watsco, Inc. |
|---|---|---|
| Wednesday, January 1, 2014 | 1751611000 | 956402000 |
| Thursday, January 1, 2015 | 1750511000 | 1007357000 |
| Friday, January 1, 2016 | 1767444000 | 1034584000 |
| Sunday, January 1, 2017 | 2047126000 | 1065659000 |
| Monday, January 1, 2018 | 2271352000 | 1120252000 |
| Tuesday, January 1, 2019 | 2838089000 | 1156956000 |
| Wednesday, January 1, 2020 | 3772831000 | 1222821000 |
| Friday, January 1, 2021 | 4750037000 | 1667545000 |
| Saturday, January 1, 2022 | 5196898000 | 2030289000 |
| Sunday, January 1, 2023 | 5926898000 | 1992140000 |
| Monday, January 1, 2024 | 6345778000 | 2044713000 |
Unlocking the unknown
In the ever-evolving landscape of the financial sector, Global Payments Inc. and Watsco, Inc. have demonstrated remarkable growth in their gross profits over the past decade. From 2014 to 2023, Global Payments Inc. has seen its gross profit soar by approximately 238%, reflecting its strategic expansions and technological advancements. Meanwhile, Watsco, Inc., a leader in HVAC distribution, has experienced a steady increase of around 108% in the same period, showcasing its resilience and market adaptability.
These trends underscore the dynamic nature of the financial and industrial sectors, offering valuable insights for investors and industry analysts alike.
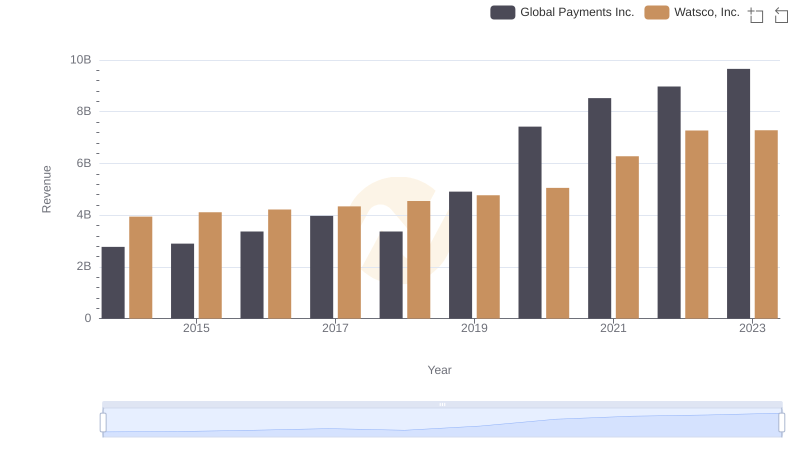
Revenue Showdown: Global Payments Inc. vs Watsco, Inc.
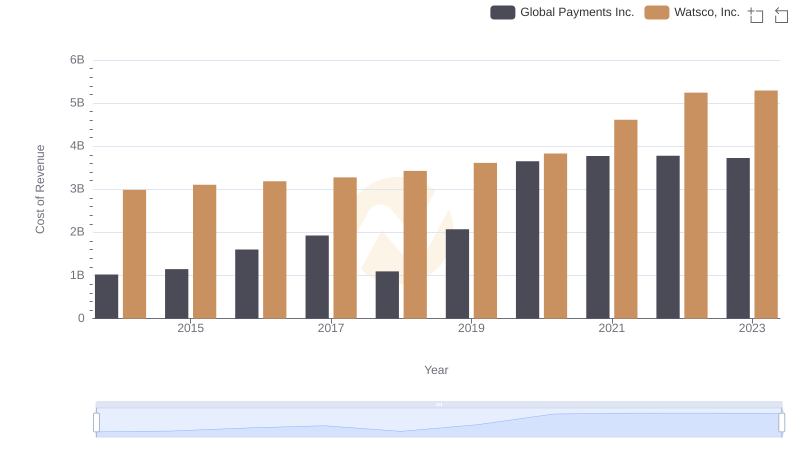
Global Payments Inc. vs Watsco, Inc.: Efficiency in Cost of Revenue Explored
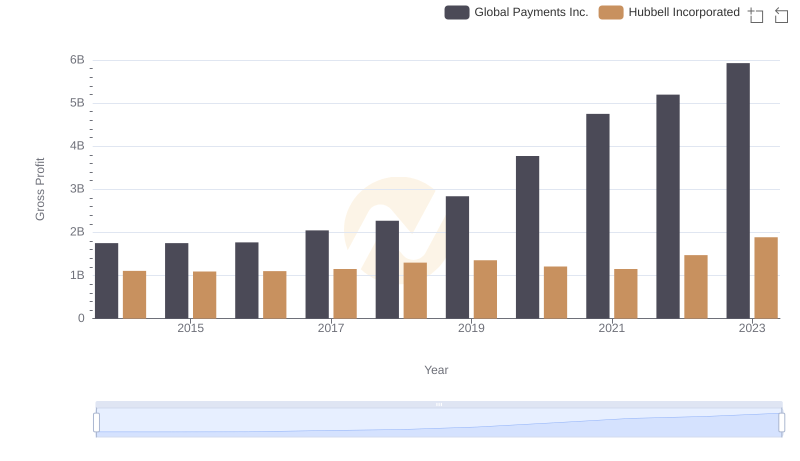
Gross Profit Comparison: Global Payments Inc. and Hubbell Incorporated Trends
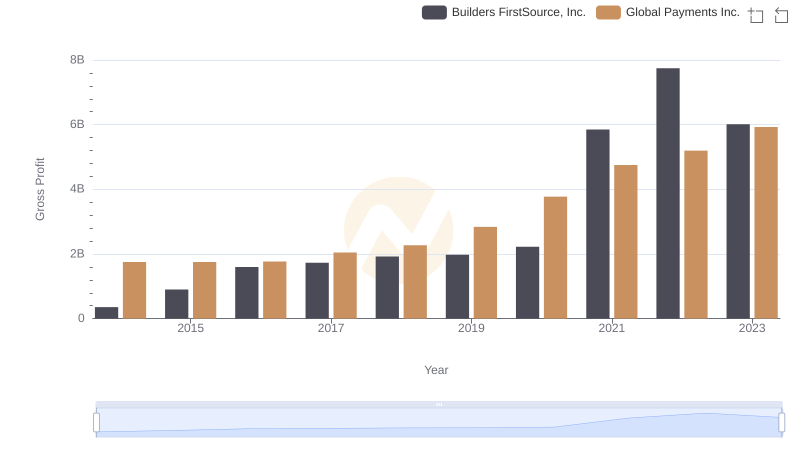
Who Generates Higher Gross Profit? Global Payments Inc. or Builders FirstSource, Inc.
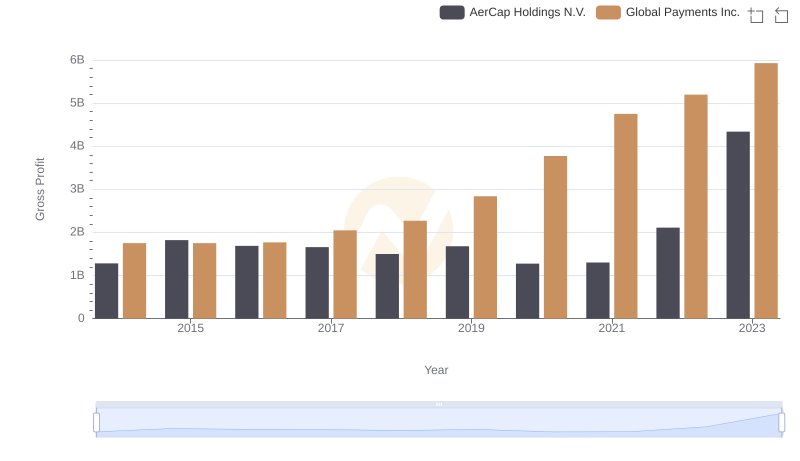
Gross Profit Comparison: Global Payments Inc. and AerCap Holdings N.V. Trends
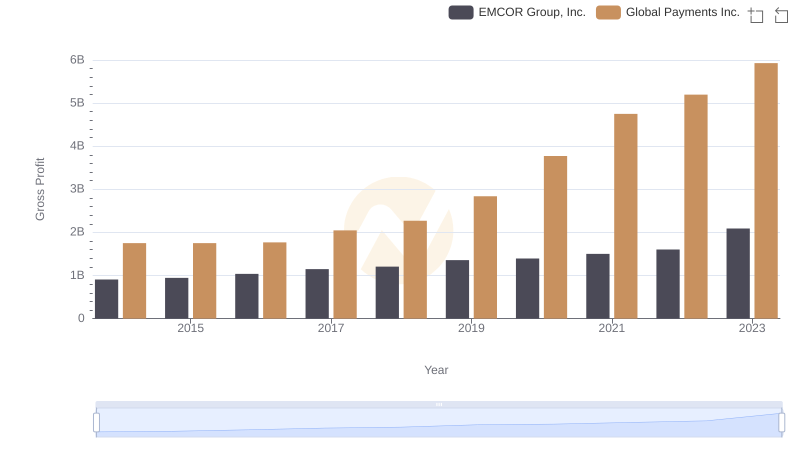
Key Insights on Gross Profit: Global Payments Inc. vs EMCOR Group, Inc.
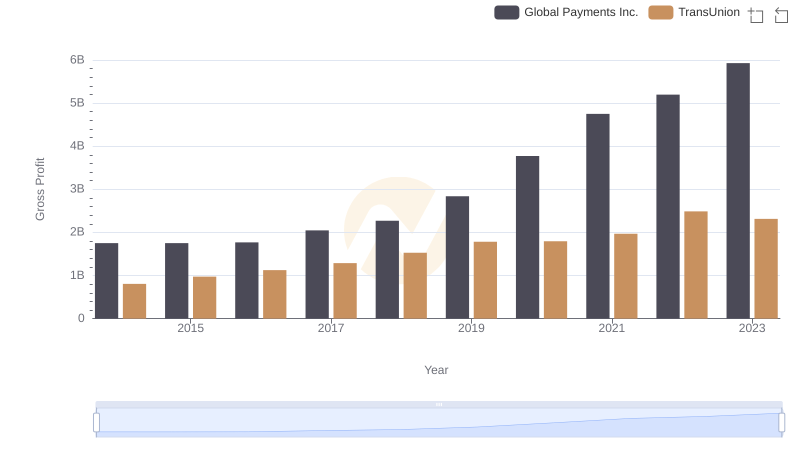
Global Payments Inc. and TransUnion: A Detailed Gross Profit Analysis
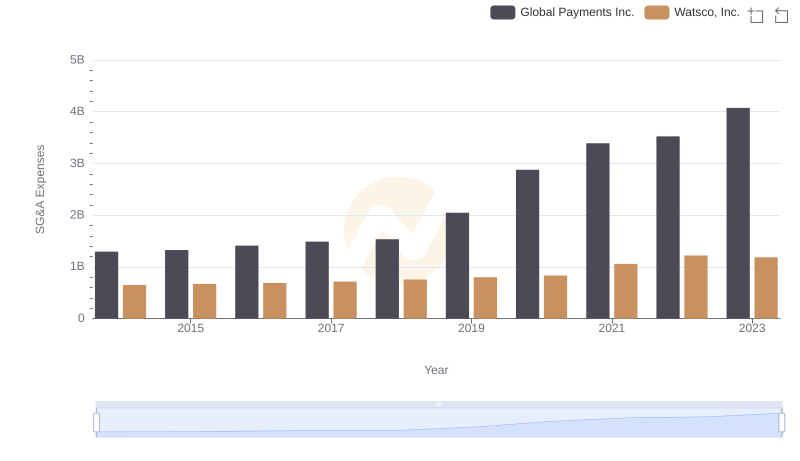
Global Payments Inc. vs Watsco, Inc.: SG&A Expense Trends
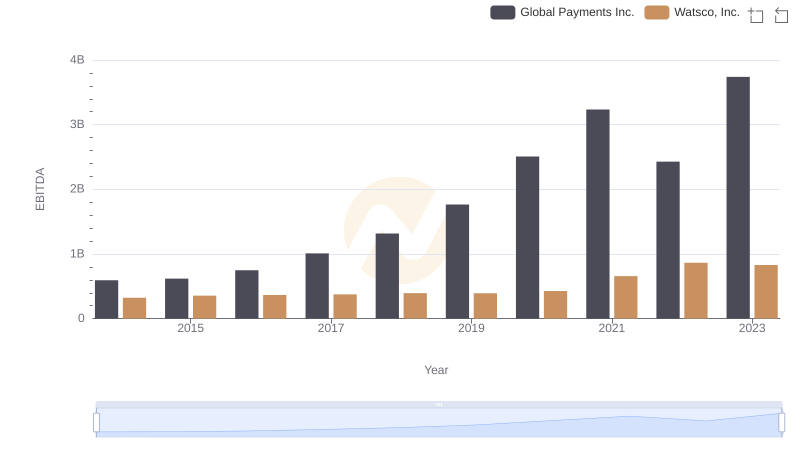
EBITDA Metrics Evaluated: Global Payments Inc. vs Watsco, Inc.