| __timestamp | AMETEK, Inc. | Elbit Systems Ltd. |
|---|---|---|
| Wednesday, January 1, 2014 | 1023344000 | 358274000 |
| Thursday, January 1, 2015 | 1093776000 | 390932000 |
| Friday, January 1, 2016 | 1007213000 | 424003291 |
| Sunday, January 1, 2017 | 1068174000 | 438616108 |
| Monday, January 1, 2018 | 1269415000 | 374866620 |
| Tuesday, January 1, 2019 | 1411422000 | 502866000 |
| Wednesday, January 1, 2020 | 1283159000 | 484464000 |
| Friday, January 1, 2021 | 1600782000 | 576645646 |
| Saturday, January 1, 2022 | 1820119000 | 505269000 |
| Sunday, January 1, 2023 | 2025843000 | 544811000 |
| Monday, January 1, 2024 | 1779562000 |
Unveiling the hidden dimensions of data
In the competitive landscape of global industries, EBITDA serves as a crucial metric for evaluating a company's financial health. Over the past decade, AMETEK, Inc. has demonstrated a robust growth trajectory, with its EBITDA increasing by approximately 98% from 2014 to 2023. In contrast, Elbit Systems Ltd. has shown a more modest growth of around 52% during the same period.
AMETEK's EBITDA growth reflects its strategic expansions and operational efficiencies, particularly noticeable in the years 2021 to 2023, where it surged by 26%. Meanwhile, Elbit Systems Ltd. experienced a peak in 2021, with a 19% increase from the previous year, highlighting its resilience in a challenging market.
These insights underscore the dynamic nature of financial performance, offering valuable lessons for investors and industry analysts alike.
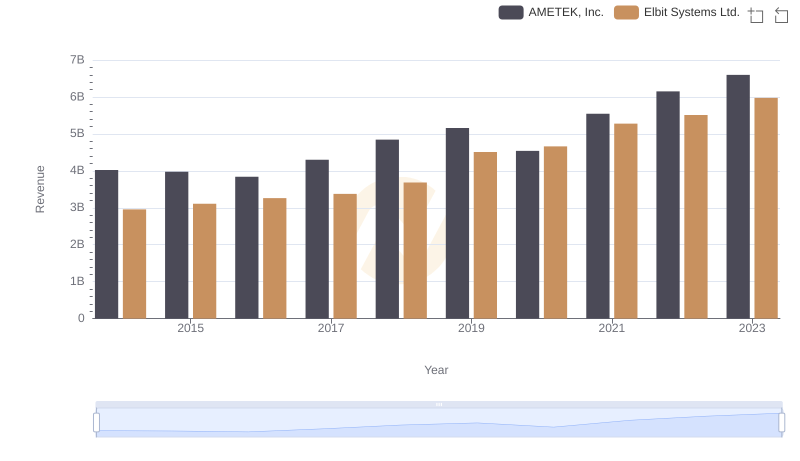
Revenue Insights: AMETEK, Inc. and Elbit Systems Ltd. Performance Compared
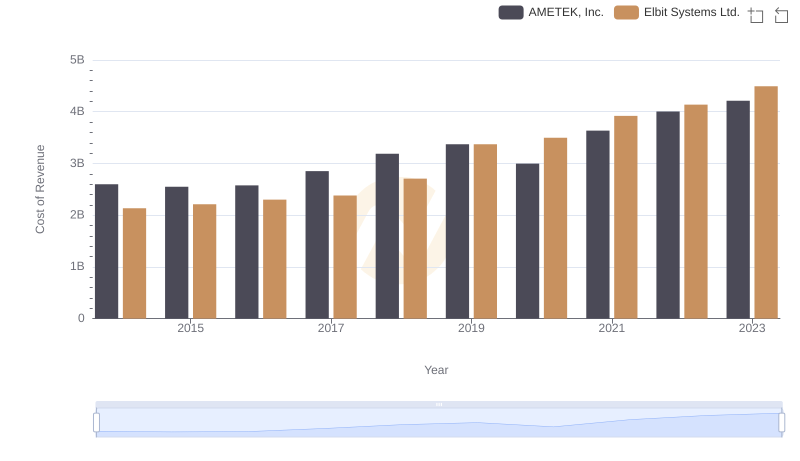
Cost of Revenue Comparison: AMETEK, Inc. vs Elbit Systems Ltd.
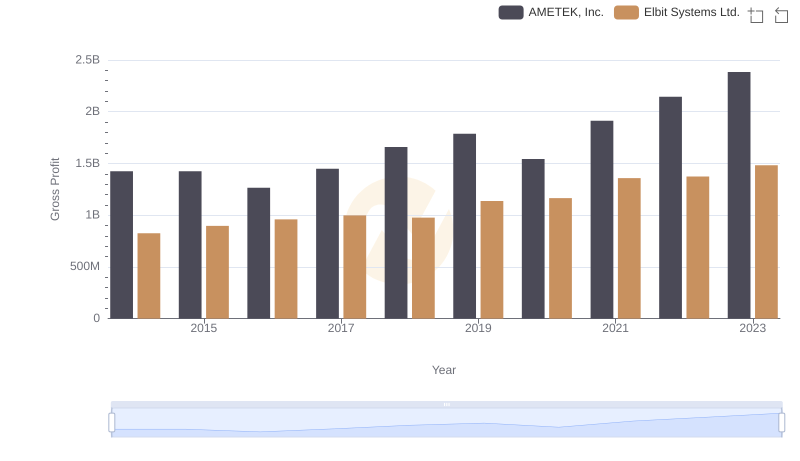
Key Insights on Gross Profit: AMETEK, Inc. vs Elbit Systems Ltd.
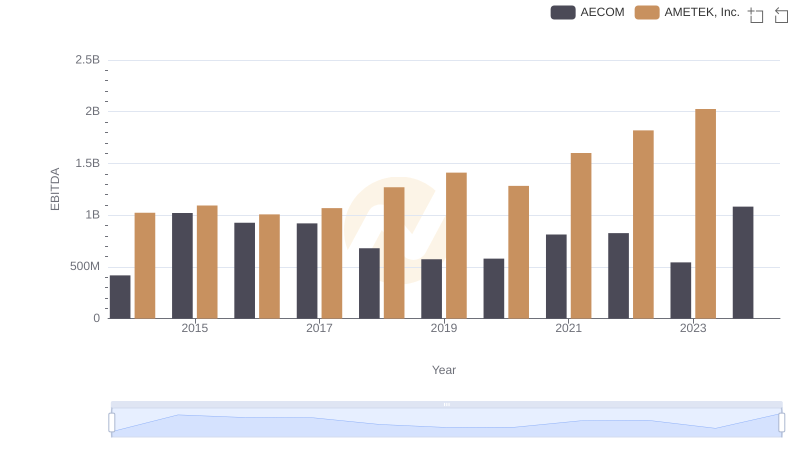
AMETEK, Inc. and AECOM: A Detailed Examination of EBITDA Performance
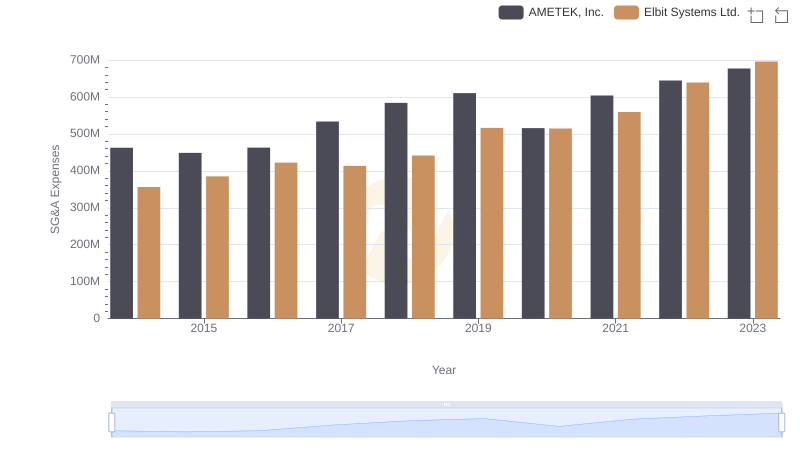
AMETEK, Inc. and Elbit Systems Ltd.: SG&A Spending Patterns Compared
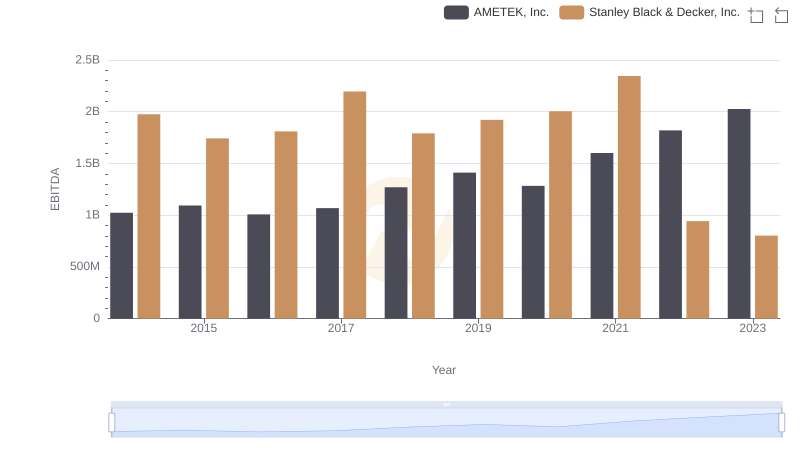
Professional EBITDA Benchmarking: AMETEK, Inc. vs Stanley Black & Decker, Inc.
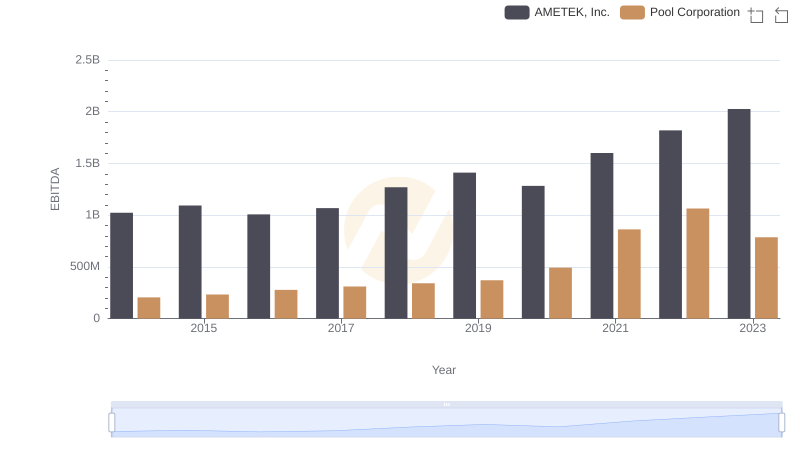
Professional EBITDA Benchmarking: AMETEK, Inc. vs Pool Corporation
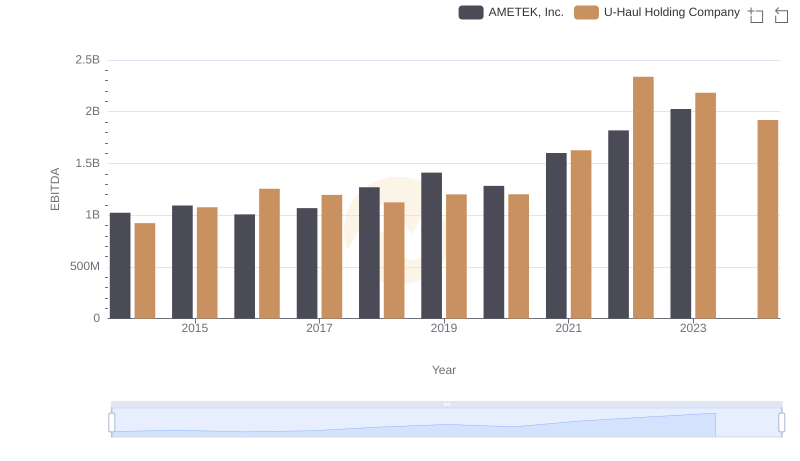
EBITDA Analysis: Evaluating AMETEK, Inc. Against U-Haul Holding Company
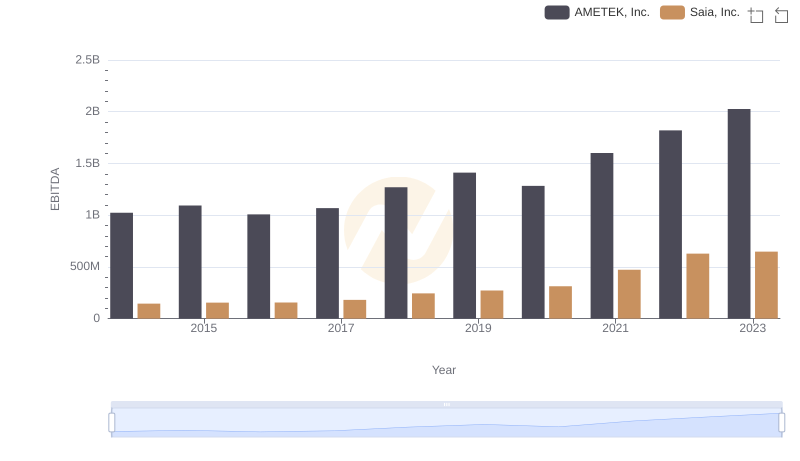
AMETEK, Inc. vs Saia, Inc.: In-Depth EBITDA Performance Comparison
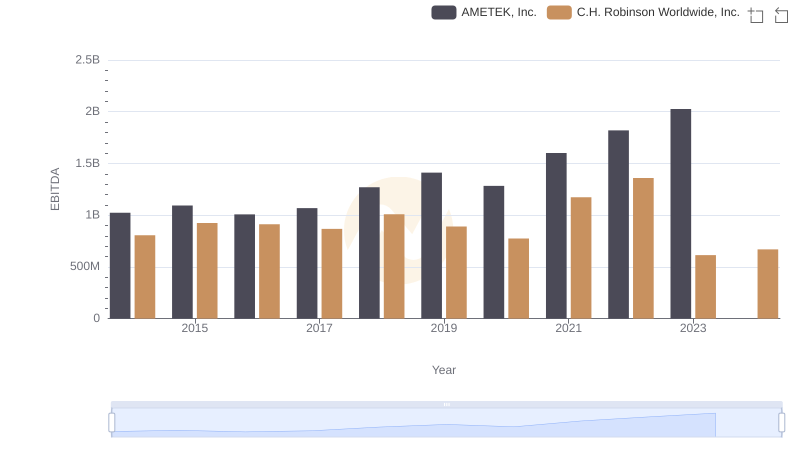
Professional EBITDA Benchmarking: AMETEK, Inc. vs C.H. Robinson Worldwide, Inc.
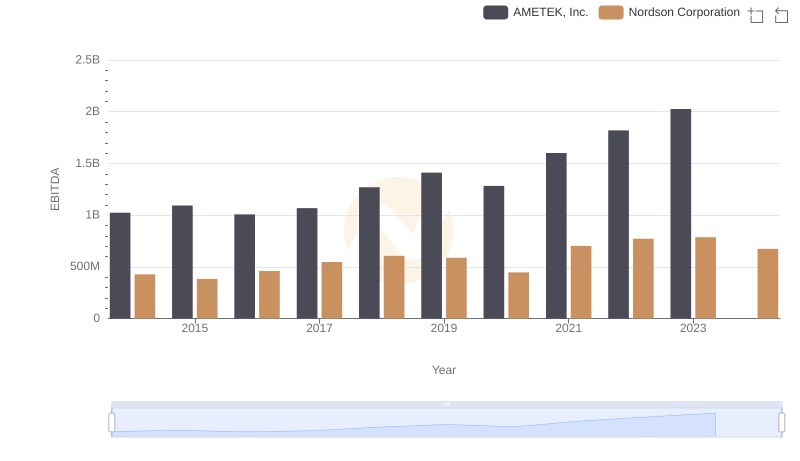
Comparative EBITDA Analysis: AMETEK, Inc. vs Nordson Corporation