| __timestamp | AMETEK, Inc. | Elbit Systems Ltd. |
|---|---|---|
| Wednesday, January 1, 2014 | 2597017000 | 2133151000 |
| Thursday, January 1, 2015 | 2549280000 | 2210528000 |
| Friday, January 1, 2016 | 2575220000 | 2300636000 |
| Sunday, January 1, 2017 | 2851431000 | 2379905000 |
| Monday, January 1, 2018 | 3186310000 | 2707505000 |
| Tuesday, January 1, 2019 | 3370897000 | 3371933000 |
| Wednesday, January 1, 2020 | 2996515000 | 3497465000 |
| Friday, January 1, 2021 | 3633900000 | 3920473000 |
| Saturday, January 1, 2022 | 4005261000 | 4138266000 |
| Sunday, January 1, 2023 | 4212484999 | 4491790000 |
| Monday, January 1, 2024 | 0 |
Igniting the spark of knowledge
In the ever-evolving landscape of global defense and industrial technology, AMETEK, Inc. and Elbit Systems Ltd. stand as titans. Over the past decade, these companies have demonstrated remarkable growth in their cost of revenue, a key indicator of operational scale and efficiency. From 2014 to 2023, AMETEK's cost of revenue surged by approximately 62%, while Elbit Systems saw an impressive 110% increase. This growth reflects their strategic expansions and adaptations to market demands. Notably, in 2019, Elbit Systems surpassed AMETEK, maintaining a lead that widened to 7% by 2023. This shift underscores Elbit's aggressive market positioning and innovation in defense technology. As we look to the future, these trends highlight the dynamic nature of the industry and the relentless pursuit of excellence by these two powerhouses.
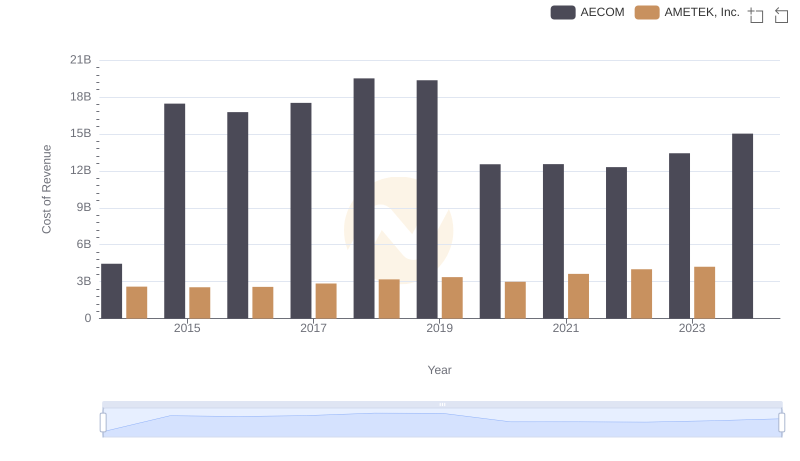
Cost of Revenue: Key Insights for AMETEK, Inc. and AECOM
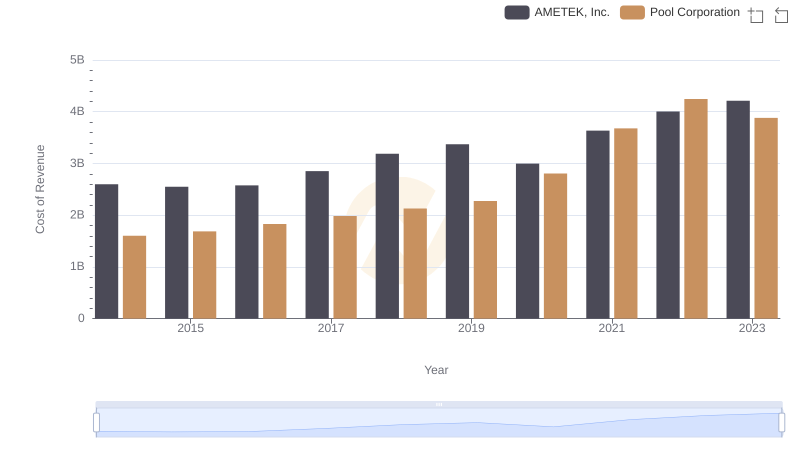
Cost of Revenue: Key Insights for AMETEK, Inc. and Pool Corporation
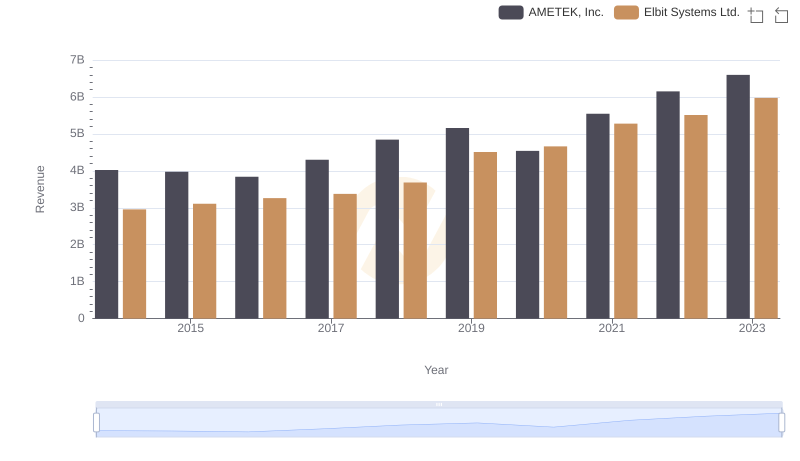
Revenue Insights: AMETEK, Inc. and Elbit Systems Ltd. Performance Compared
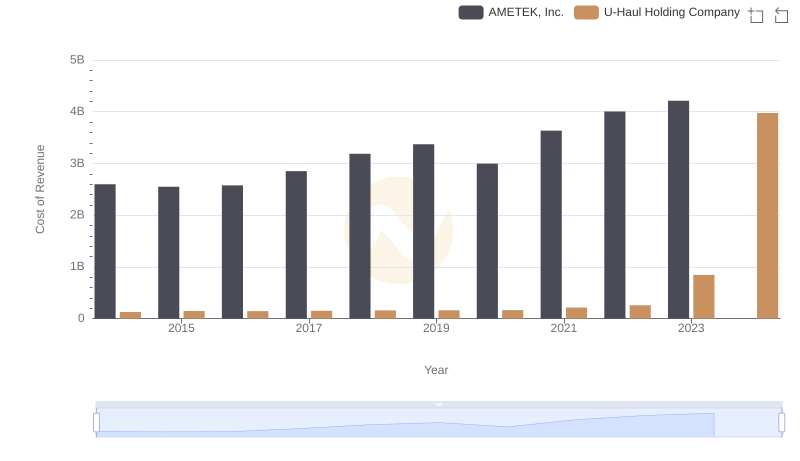
Comparing Cost of Revenue Efficiency: AMETEK, Inc. vs U-Haul Holding Company
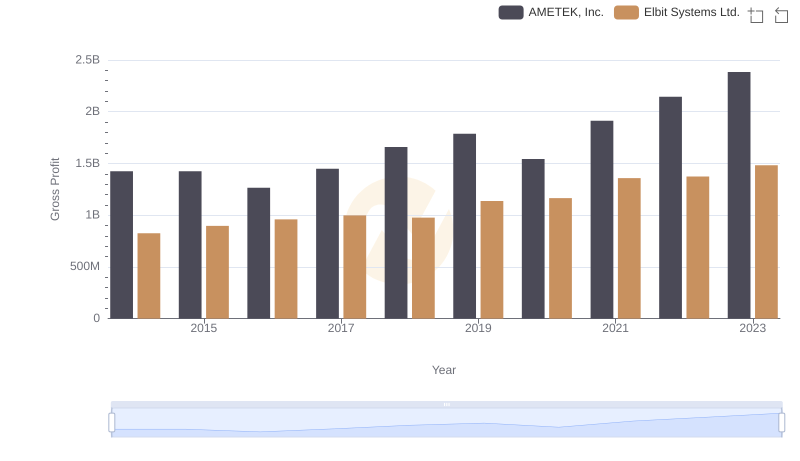
Key Insights on Gross Profit: AMETEK, Inc. vs Elbit Systems Ltd.
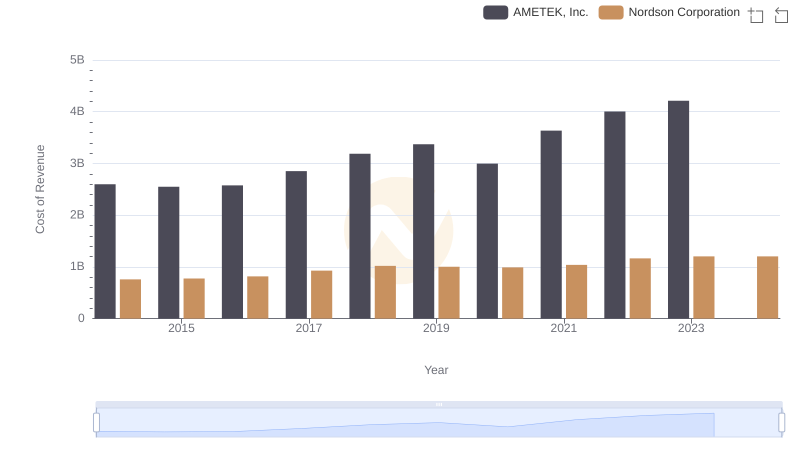
Analyzing Cost of Revenue: AMETEK, Inc. and Nordson Corporation
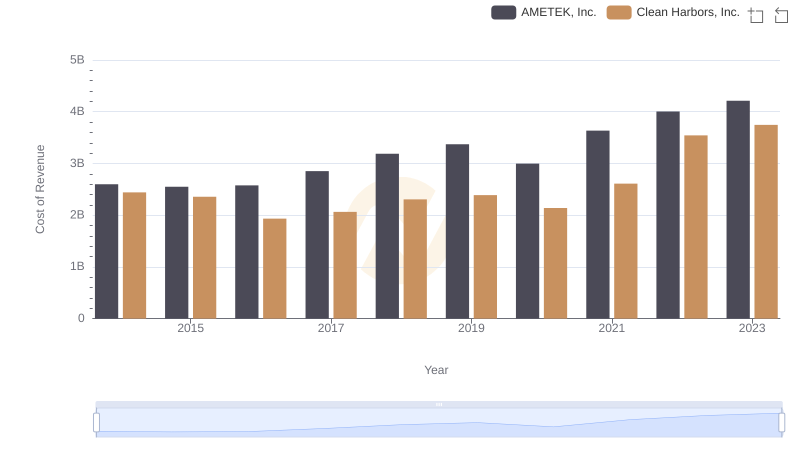
Analyzing Cost of Revenue: AMETEK, Inc. and Clean Harbors, Inc.
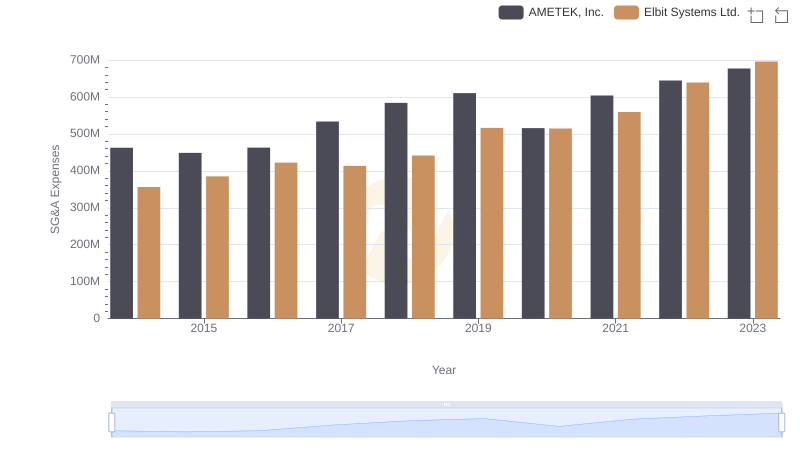
AMETEK, Inc. and Elbit Systems Ltd.: SG&A Spending Patterns Compared
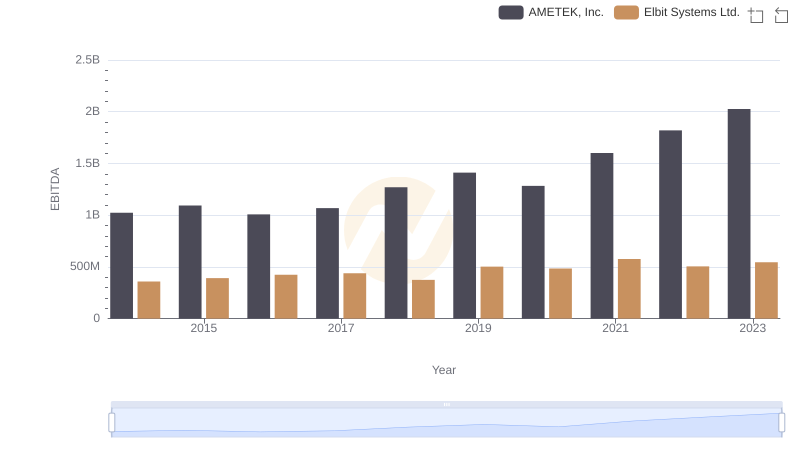
EBITDA Metrics Evaluated: AMETEK, Inc. vs Elbit Systems Ltd.