| __timestamp | AMETEK, Inc. | Stanley Black & Decker, Inc. |
|---|---|---|
| Wednesday, January 1, 2014 | 1023344000 | 1975400000 |
| Thursday, January 1, 2015 | 1093776000 | 1741900000 |
| Friday, January 1, 2016 | 1007213000 | 1810200000 |
| Sunday, January 1, 2017 | 1068174000 | 2196000000 |
| Monday, January 1, 2018 | 1269415000 | 1791200000 |
| Tuesday, January 1, 2019 | 1411422000 | 1920600000 |
| Wednesday, January 1, 2020 | 1283159000 | 2004200000 |
| Friday, January 1, 2021 | 1600782000 | 2345500000 |
| Saturday, January 1, 2022 | 1820119000 | 942800000 |
| Sunday, January 1, 2023 | 2025843000 | 802700000 |
| Monday, January 1, 2024 | 1779562000 | 286300000 |
Unlocking the unknown
In the competitive landscape of industrial manufacturing, AMETEK, Inc. and Stanley Black & Decker, Inc. have been pivotal players. Over the past decade, from 2014 to 2023, these giants have showcased intriguing trends in their EBITDA performance. AMETEK, Inc. has demonstrated a robust growth trajectory, with its EBITDA increasing by nearly 98% over this period. In contrast, Stanley Black & Decker, Inc. experienced a more volatile journey, peaking in 2021 before a significant decline of over 65% by 2023. This divergence highlights AMETEK's consistent strategic advancements and operational efficiencies, while Stanley Black & Decker faces challenges in maintaining its earlier momentum. As the industrial sector evolves, these insights provide a window into the strategic maneuvers and market dynamics shaping these industry leaders.

AMETEK, Inc. vs Stanley Black & Decker, Inc.: Annual Revenue Growth Compared
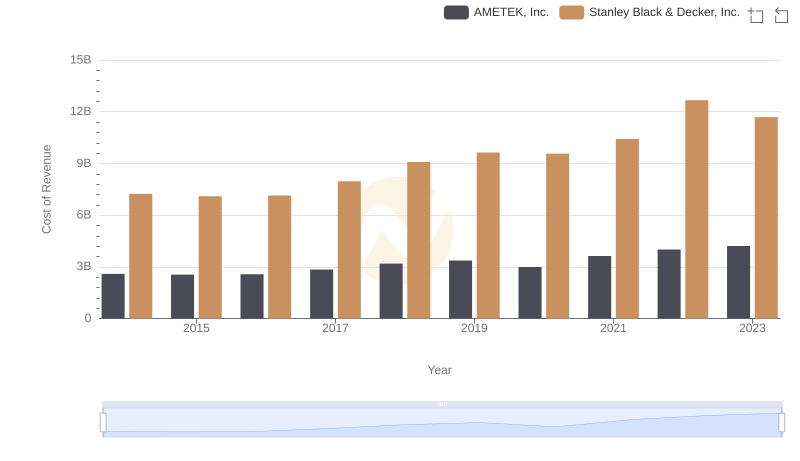
Comparing Cost of Revenue Efficiency: AMETEK, Inc. vs Stanley Black & Decker, Inc.

AMETEK, Inc. and Stanley Black & Decker, Inc.: SG&A Spending Patterns Compared
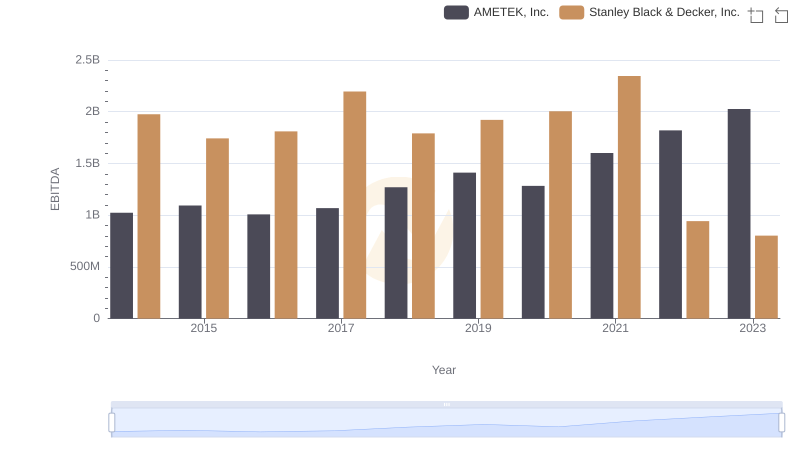
Comparative EBITDA Analysis: AMETEK, Inc. vs Stanley Black & Decker, Inc.
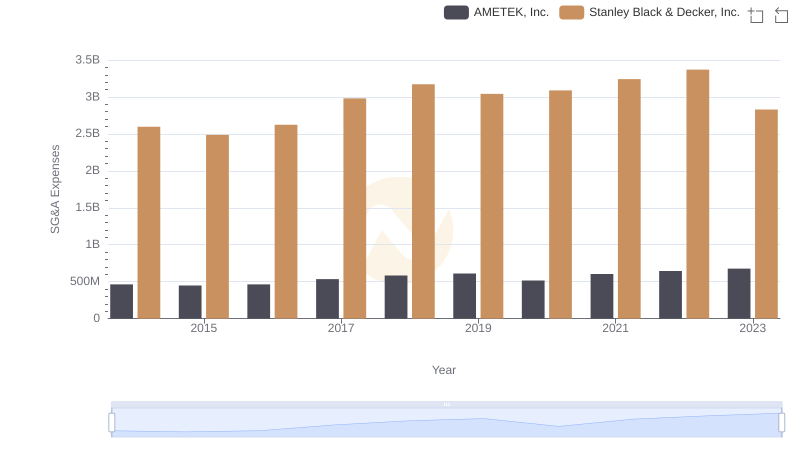
AMETEK, Inc. and Stanley Black & Decker, Inc.: SG&A Spending Patterns Compared
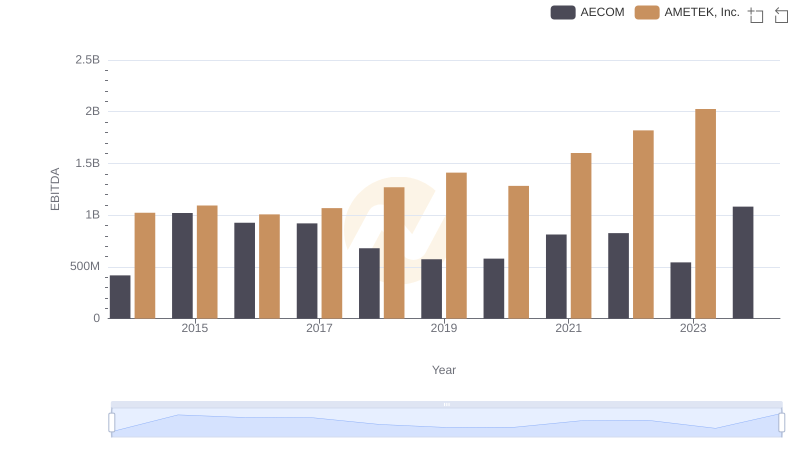
AMETEK, Inc. and AECOM: A Detailed Examination of EBITDA Performance
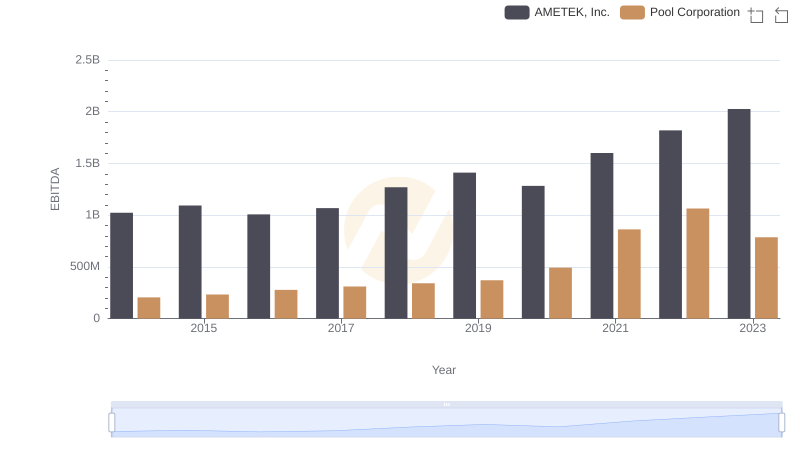
Professional EBITDA Benchmarking: AMETEK, Inc. vs Pool Corporation