| __timestamp | AMETEK, Inc. | Elbit Systems Ltd. |
|---|---|---|
| Wednesday, January 1, 2014 | 4021964000 | 2958248000 |
| Thursday, January 1, 2015 | 3974295000 | 3107581000 |
| Friday, January 1, 2016 | 3840087000 | 3260219000 |
| Sunday, January 1, 2017 | 4300170000 | 3377825000 |
| Monday, January 1, 2018 | 4845872000 | 3683684000 |
| Tuesday, January 1, 2019 | 5158557000 | 4508400000 |
| Wednesday, January 1, 2020 | 4540029000 | 4662572000 |
| Friday, January 1, 2021 | 5546514000 | 5278521000 |
| Saturday, January 1, 2022 | 6150530000 | 5511549000 |
| Sunday, January 1, 2023 | 6596950000 | 5974744000 |
| Monday, January 1, 2024 | 6941180000 |
Igniting the spark of knowledge
In the ever-evolving landscape of global industries, AMETEK, Inc. and Elbit Systems Ltd. have demonstrated remarkable revenue trajectories over the past decade. From 2014 to 2023, AMETEK, Inc. has seen its revenue grow by approximately 64%, starting from $4.02 billion and reaching $6.60 billion. This growth reflects AMETEK's strategic expansions and innovations in electronic instruments and electromechanical devices.
Meanwhile, Elbit Systems Ltd., a leader in defense electronics, has also shown impressive growth, with its revenue increasing by about 102% over the same period, from $2.96 billion to $5.97 billion. This surge underscores Elbit's expanding footprint in global defense markets.
Both companies have navigated economic fluctuations and industry challenges, showcasing resilience and adaptability. As we look to the future, these trends highlight the dynamic nature of industrial growth and the potential for continued success.
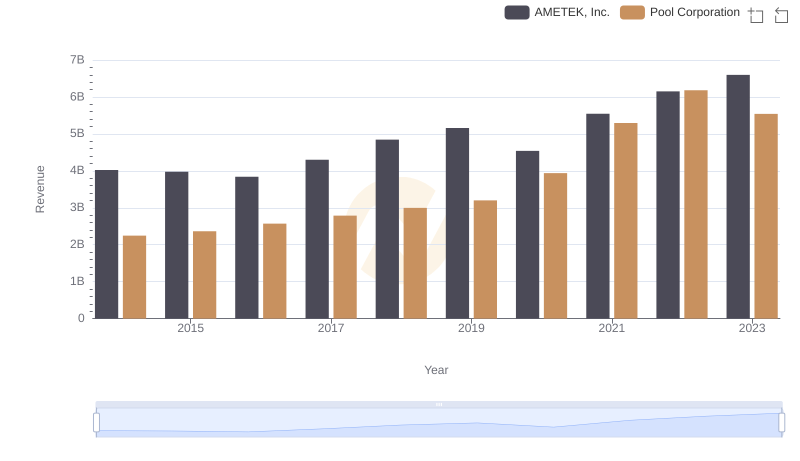
AMETEK, Inc. vs Pool Corporation: Annual Revenue Growth Compared
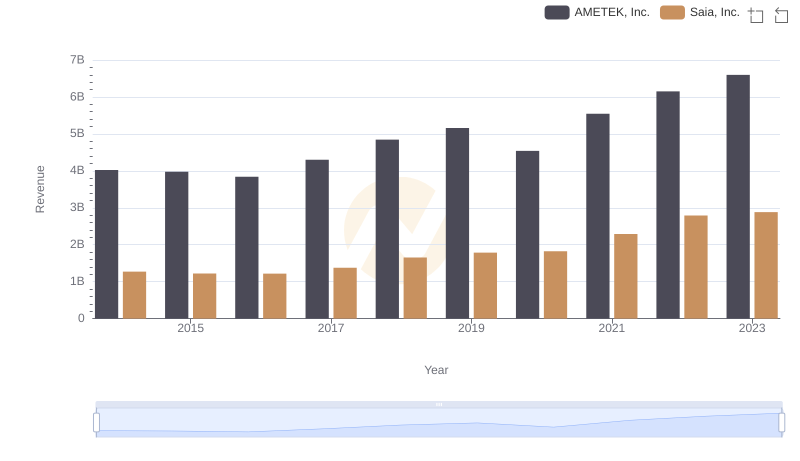
Revenue Showdown: AMETEK, Inc. vs Saia, Inc.
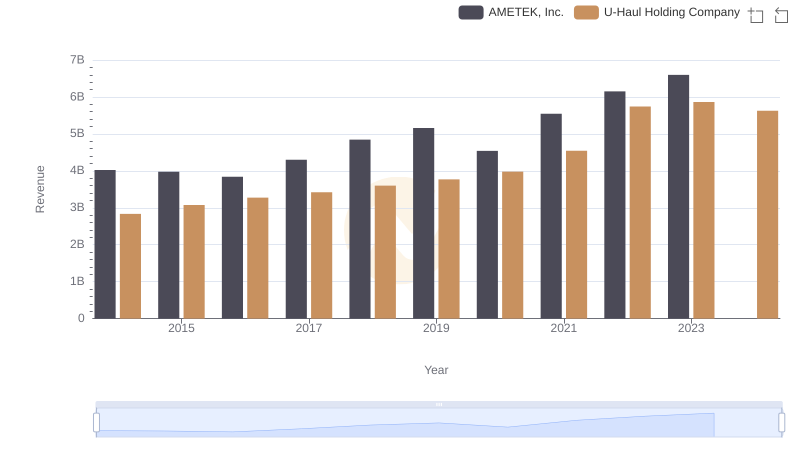
AMETEK, Inc. vs U-Haul Holding Company: Annual Revenue Growth Compared
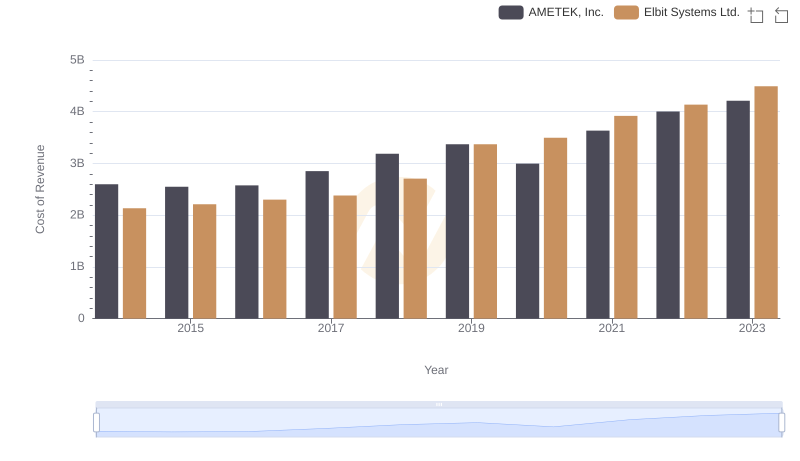
Cost of Revenue Comparison: AMETEK, Inc. vs Elbit Systems Ltd.
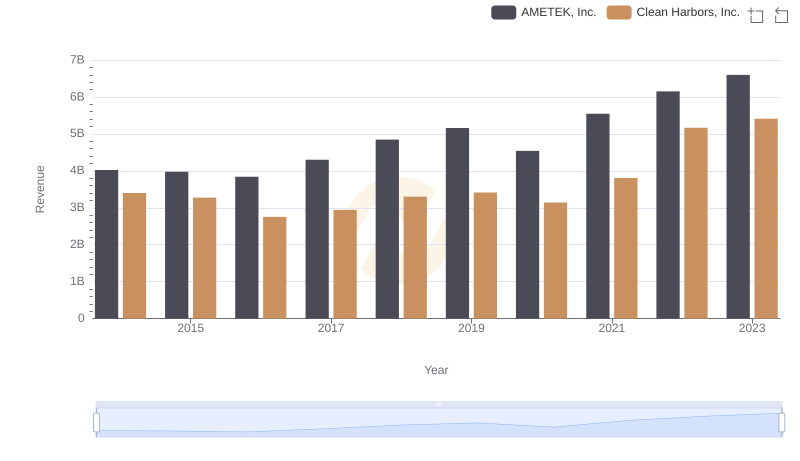
Revenue Showdown: AMETEK, Inc. vs Clean Harbors, Inc.
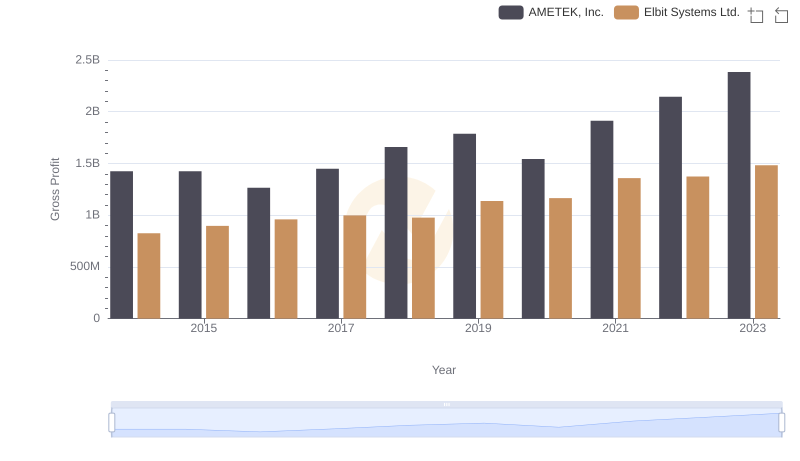
Key Insights on Gross Profit: AMETEK, Inc. vs Elbit Systems Ltd.
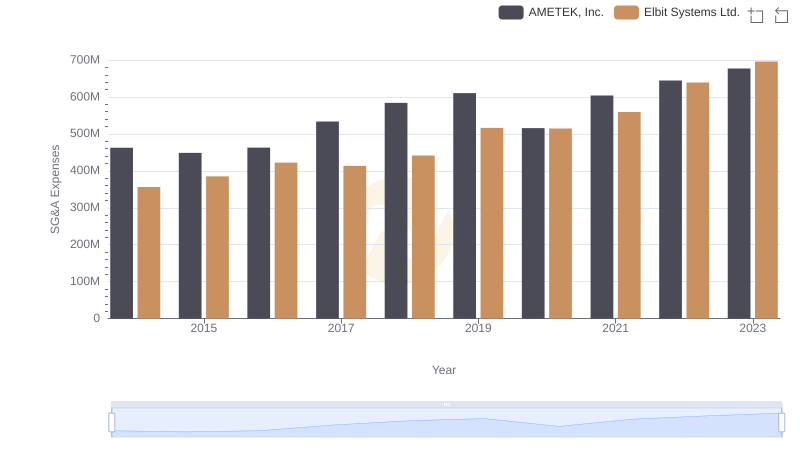
AMETEK, Inc. and Elbit Systems Ltd.: SG&A Spending Patterns Compared
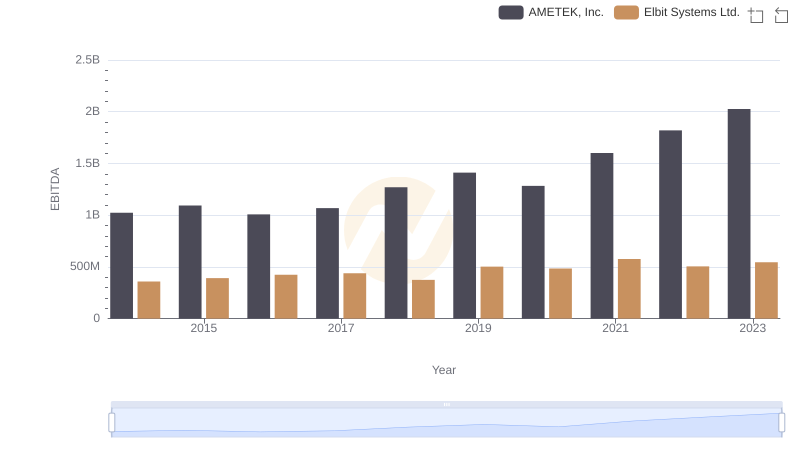
EBITDA Metrics Evaluated: AMETEK, Inc. vs Elbit Systems Ltd.