| __timestamp | Cummins Inc. | Waste Management, Inc. |
|---|---|---|
| Wednesday, January 1, 2014 | 2498000000 | 3509000000 |
| Thursday, January 1, 2015 | 2604000000 | 3342000000 |
| Friday, January 1, 2016 | 2534000000 | 3713000000 |
| Sunday, January 1, 2017 | 3035000000 | 3996000000 |
| Monday, January 1, 2018 | 3486000000 | 4212000000 |
| Tuesday, January 1, 2019 | 3623000000 | 4344000000 |
| Wednesday, January 1, 2020 | 3125000000 | 4149000000 |
| Friday, January 1, 2021 | 2862000000 | 4956000000 |
| Saturday, January 1, 2022 | 3802000000 | 5466000000 |
| Sunday, January 1, 2023 | 3025000000 | 5592000000 |
| Monday, January 1, 2024 | 6338000000 | 5128000000 |
Unveiling the hidden dimensions of data
In the ever-evolving landscape of American industry, Waste Management, Inc. and Cummins Inc. have emerged as stalwarts of financial resilience. Over the past decade, from 2014 to 2023, these two giants have showcased impressive EBITDA growth, a key indicator of operational performance. Waste Management, Inc. has consistently outperformed Cummins Inc., with an average EBITDA of approximately 4.3 billion, compared to Cummins' 3.1 billion. Notably, Waste Management's EBITDA surged by nearly 60% from 2014 to 2023, peaking at 5.6 billion in 2023. Meanwhile, Cummins Inc. experienced a more modest growth of around 21% over the same period. This data underscores Waste Management's robust expansion strategy and operational efficiency, while Cummins continues to hold its ground in the competitive industrial sector. As we look to the future, these trends offer valuable insights into the strategic directions of these industry leaders.
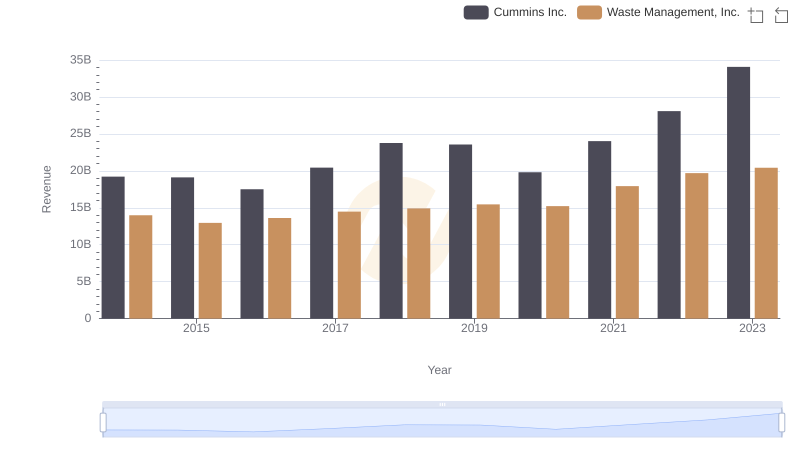
Waste Management, Inc. vs Cummins Inc.: Examining Key Revenue Metrics
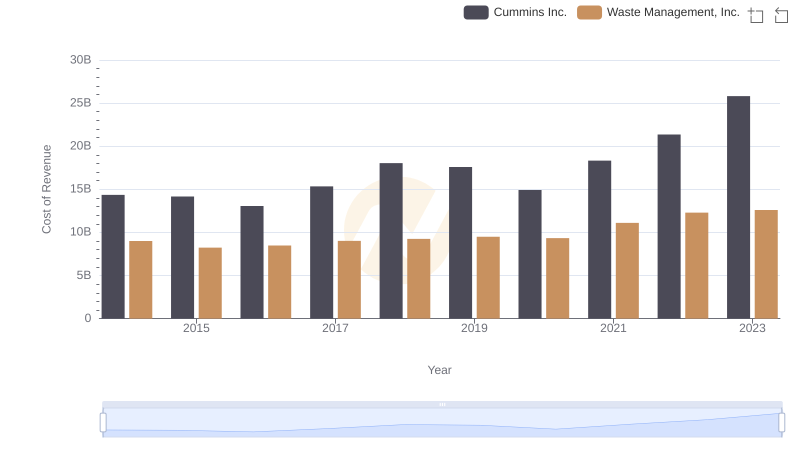
Waste Management, Inc. vs Cummins Inc.: Efficiency in Cost of Revenue Explored
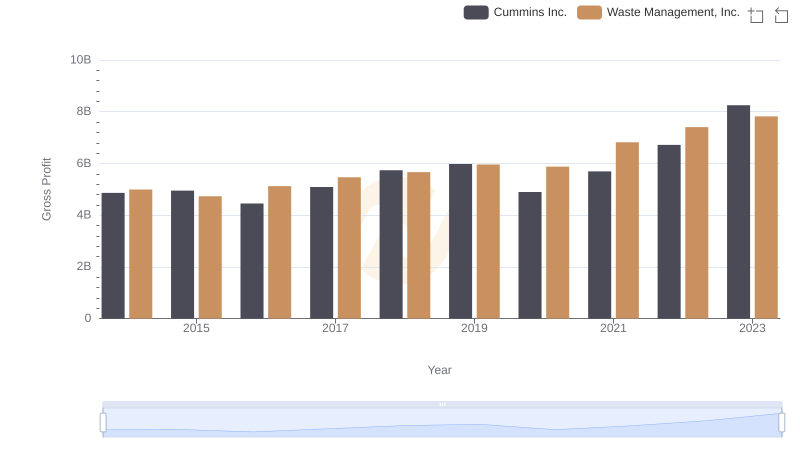
Who Generates Higher Gross Profit? Waste Management, Inc. or Cummins Inc.
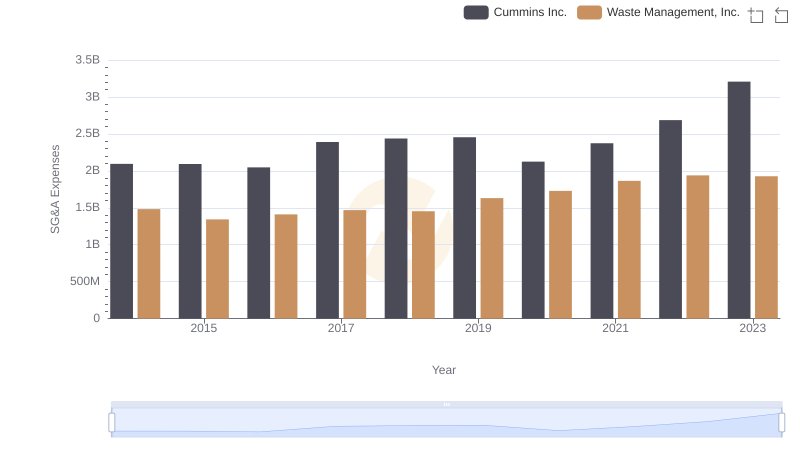
Breaking Down SG&A Expenses: Waste Management, Inc. vs Cummins Inc.
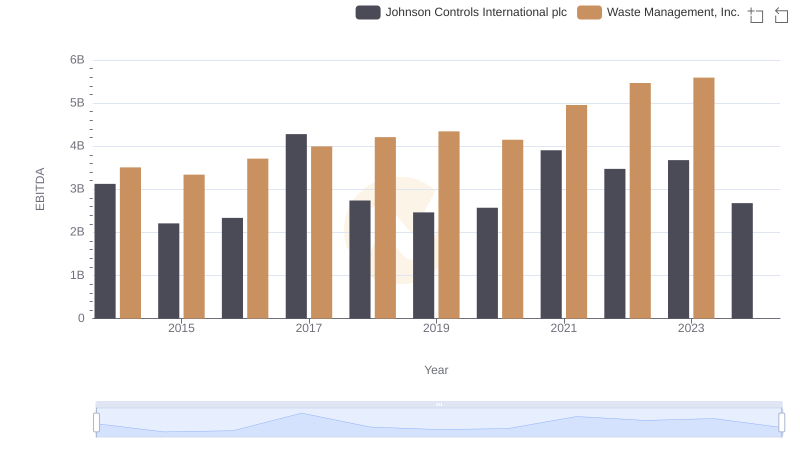
EBITDA Metrics Evaluated: Waste Management, Inc. vs Johnson Controls International plc
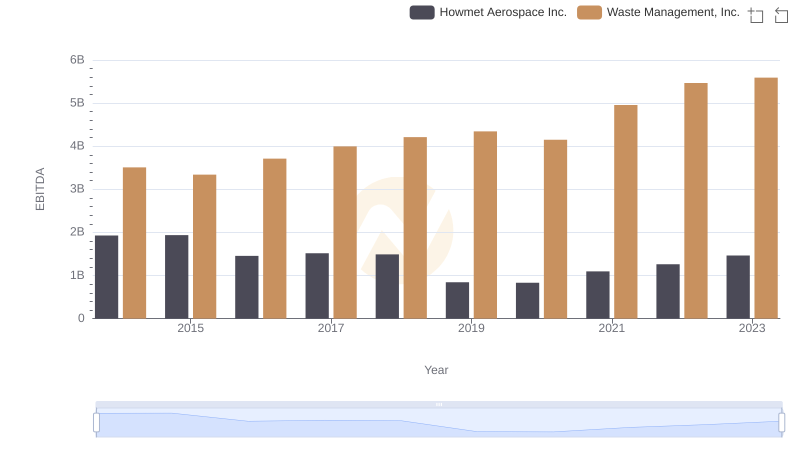
A Side-by-Side Analysis of EBITDA: Waste Management, Inc. and Howmet Aerospace Inc.
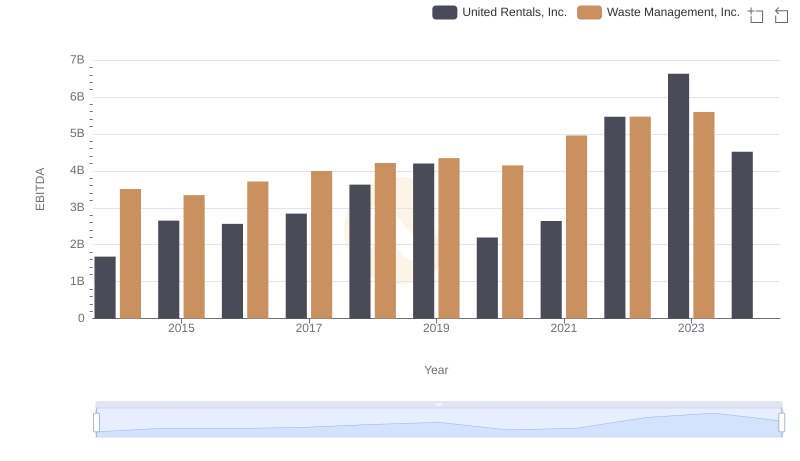
Comprehensive EBITDA Comparison: Waste Management, Inc. vs United Rentals, Inc.
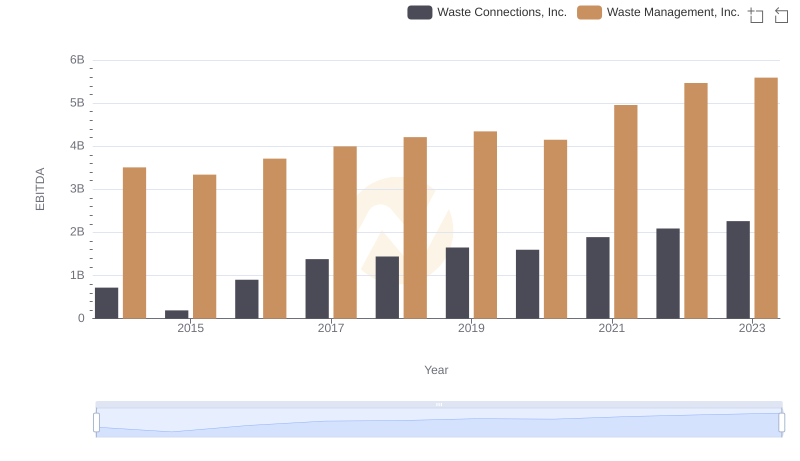
A Side-by-Side Analysis of EBITDA: Waste Management, Inc. and Waste Connections, Inc.
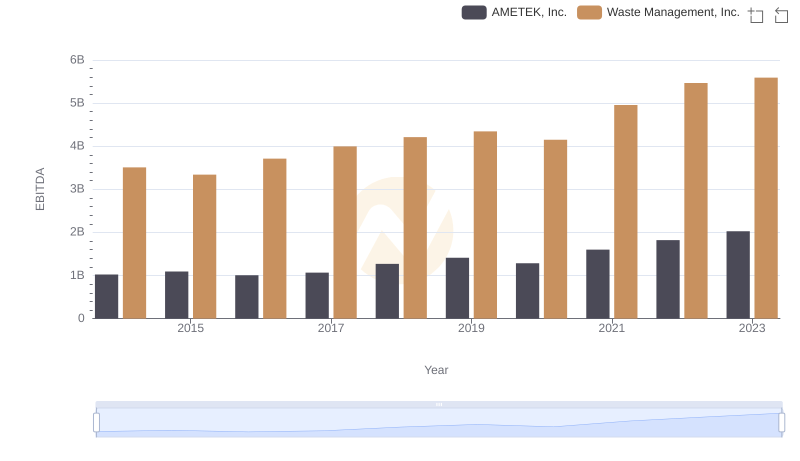
Comprehensive EBITDA Comparison: Waste Management, Inc. vs AMETEK, Inc.
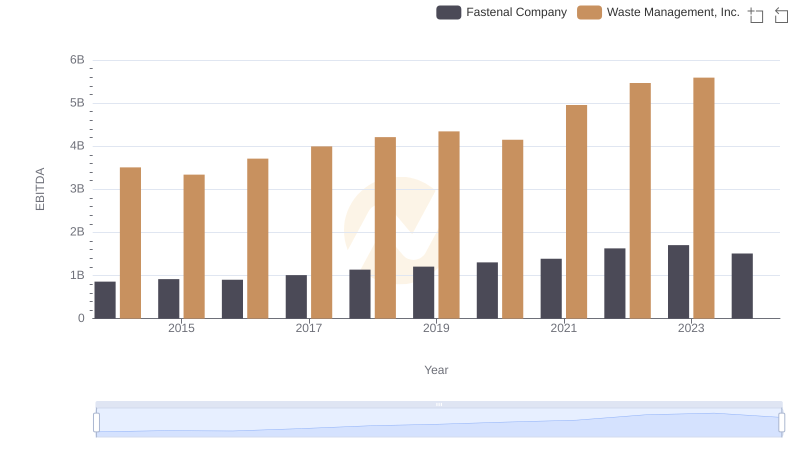
EBITDA Analysis: Evaluating Waste Management, Inc. Against Fastenal Company
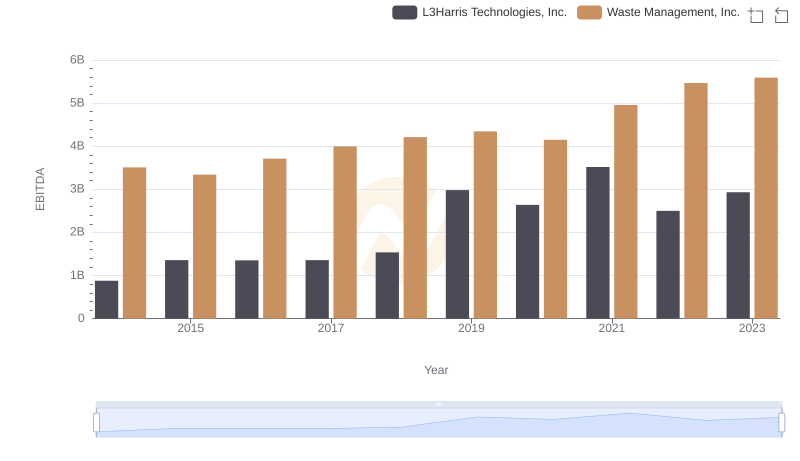
Waste Management, Inc. and L3Harris Technologies, Inc.: A Detailed Examination of EBITDA Performance
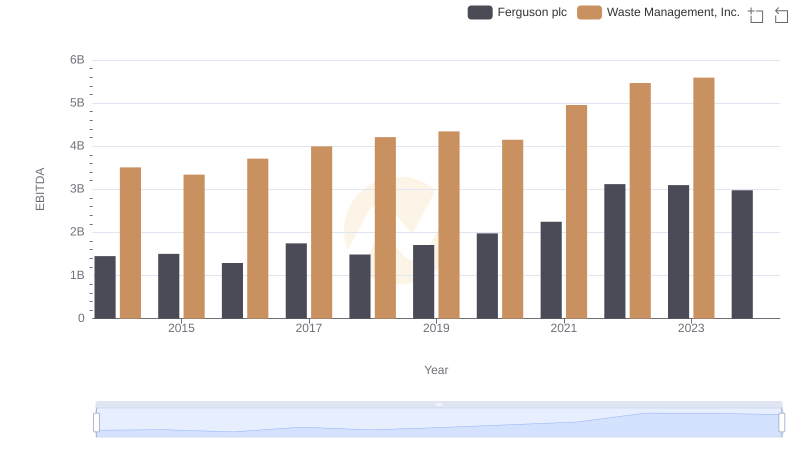
Waste Management, Inc. and Ferguson plc: A Detailed Examination of EBITDA Performance