| __timestamp | Old Dominion Freight Line, Inc. | Waste Management, Inc. |
|---|---|---|
| Wednesday, January 1, 2014 | 585590000 | 3509000000 |
| Thursday, January 1, 2015 | 660570000 | 3342000000 |
| Friday, January 1, 2016 | 671786000 | 3713000000 |
| Sunday, January 1, 2017 | 783749000 | 3996000000 |
| Monday, January 1, 2018 | 1046059000 | 4212000000 |
| Tuesday, January 1, 2019 | 1078007000 | 4344000000 |
| Wednesday, January 1, 2020 | 1168149000 | 4149000000 |
| Friday, January 1, 2021 | 1651501000 | 4956000000 |
| Saturday, January 1, 2022 | 2118962000 | 5466000000 |
| Sunday, January 1, 2023 | 1972689000 | 5592000000 |
| Monday, January 1, 2024 | 5128000000 |
Data in motion
In the past decade, Waste Management, Inc. and Old Dominion Freight Line, Inc. have demonstrated remarkable growth in their EBITDA, a key indicator of financial health. Waste Management, a leader in waste services, has seen its EBITDA rise by approximately 60% from 2014 to 2023, peaking at $5.6 billion in 2023. Meanwhile, Old Dominion Freight Line, a prominent player in the freight industry, experienced an impressive 237% increase, reaching nearly $2.1 billion in 2022.
This growth reflects the companies' strategic adaptations to market demands and operational efficiencies. Waste Management's consistent upward trend underscores its resilience and market dominance, while Old Dominion's rapid ascent highlights its agility and expansion in the logistics sector. As we look to the future, these trends suggest continued robust performance, driven by innovation and sustainability initiatives.

Revenue Showdown: Waste Management, Inc. vs Old Dominion Freight Line, Inc.
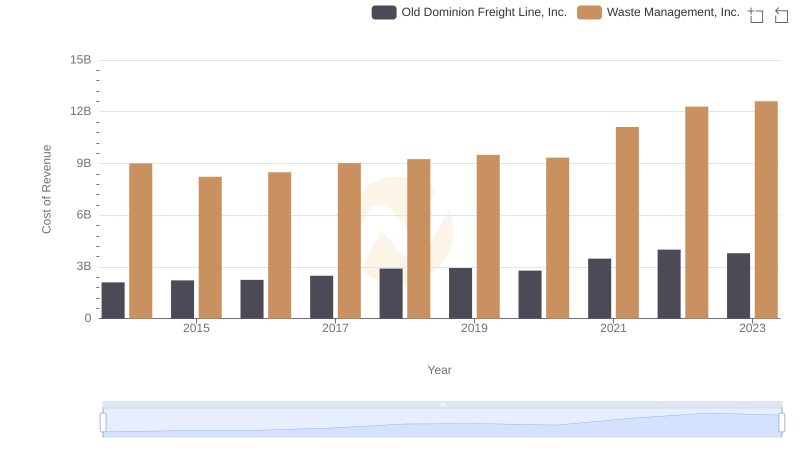
Cost of Revenue: Key Insights for Waste Management, Inc. and Old Dominion Freight Line, Inc.
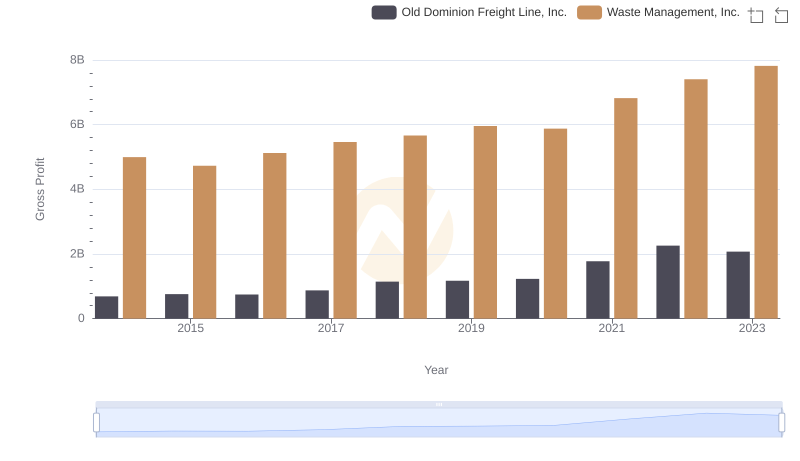
Who Generates Higher Gross Profit? Waste Management, Inc. or Old Dominion Freight Line, Inc.
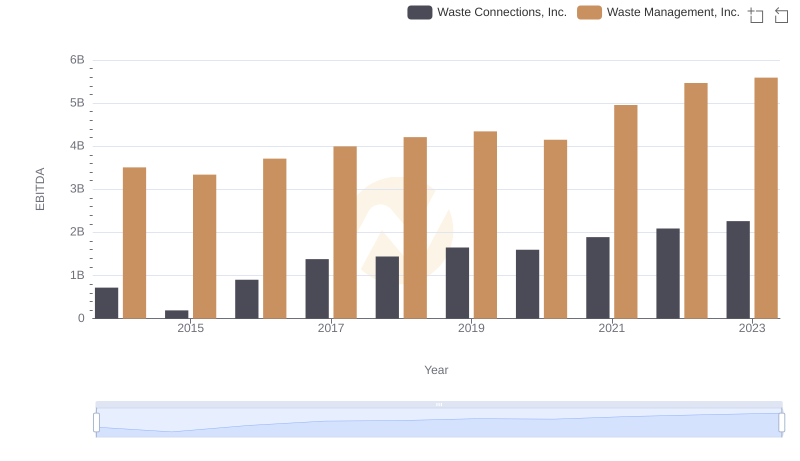
A Side-by-Side Analysis of EBITDA: Waste Management, Inc. and Waste Connections, Inc.

SG&A Efficiency Analysis: Comparing Waste Management, Inc. and Old Dominion Freight Line, Inc.
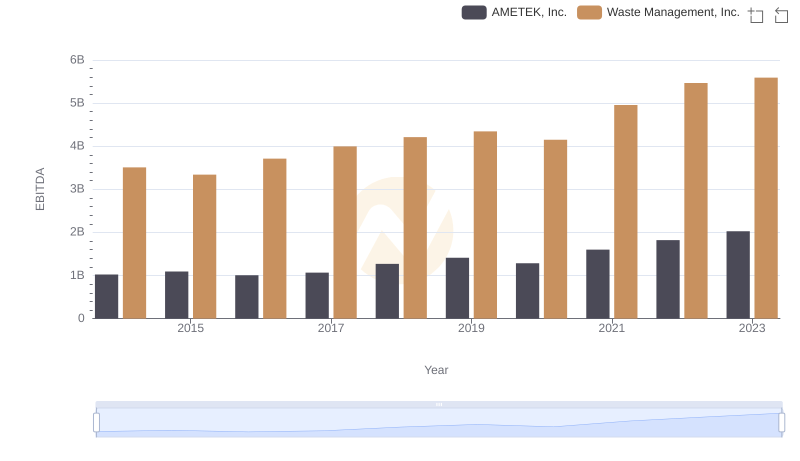
Comprehensive EBITDA Comparison: Waste Management, Inc. vs AMETEK, Inc.
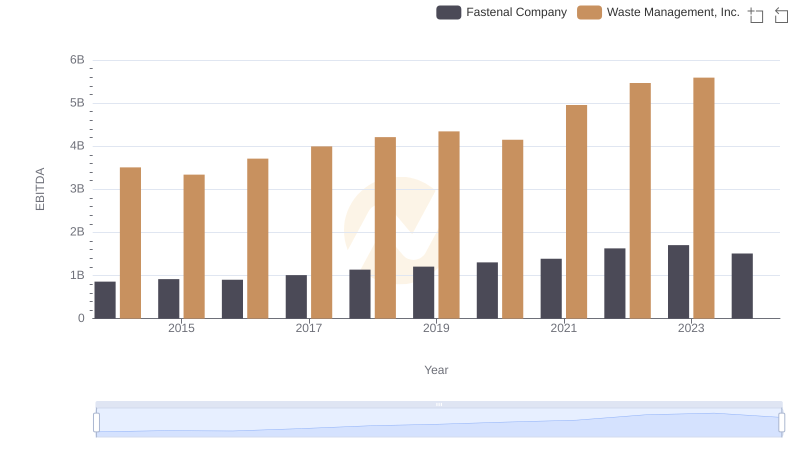
EBITDA Analysis: Evaluating Waste Management, Inc. Against Fastenal Company
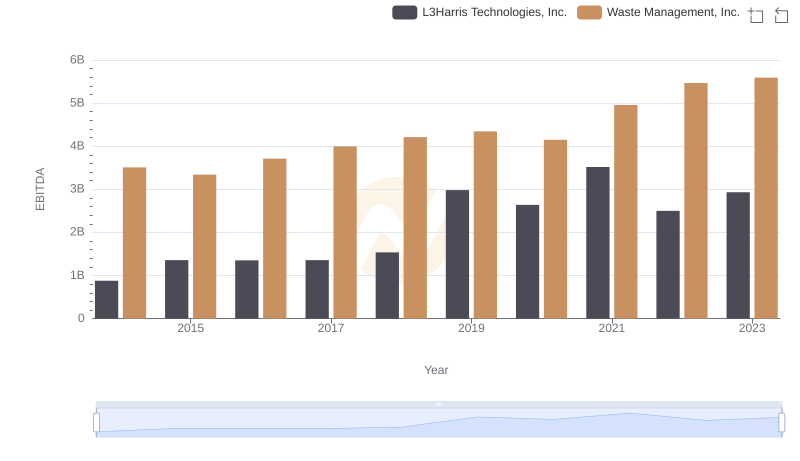
Waste Management, Inc. and L3Harris Technologies, Inc.: A Detailed Examination of EBITDA Performance
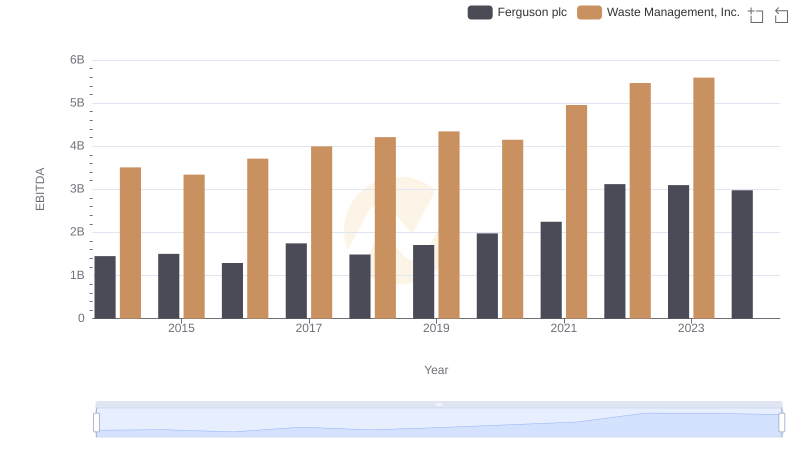
Waste Management, Inc. and Ferguson plc: A Detailed Examination of EBITDA Performance
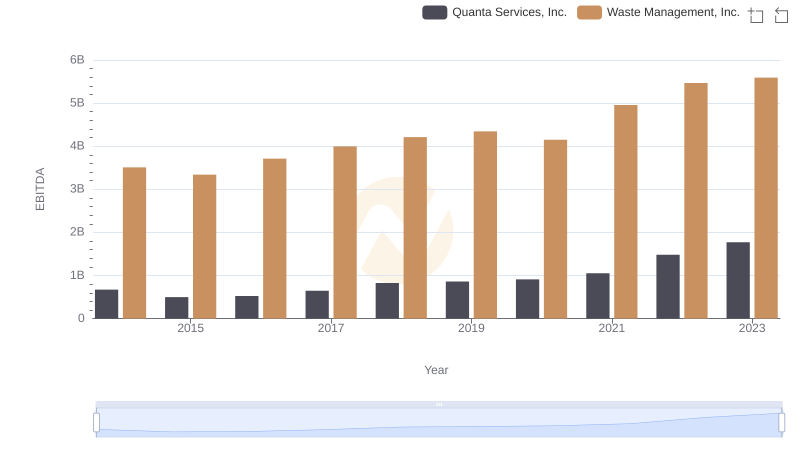
Professional EBITDA Benchmarking: Waste Management, Inc. vs Quanta Services, Inc.
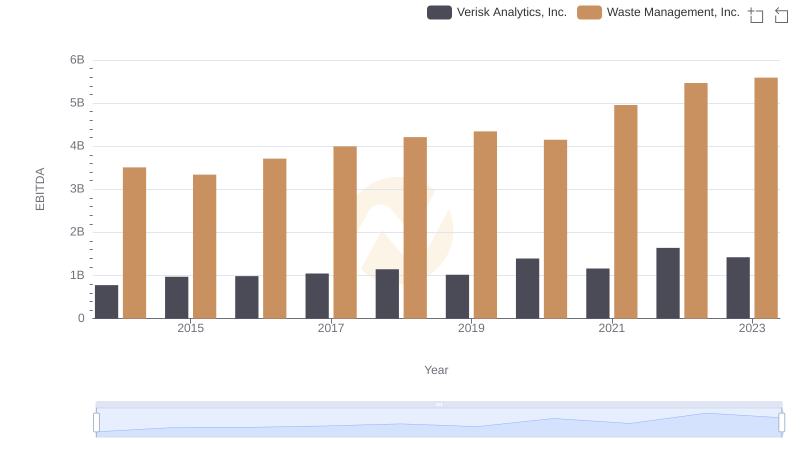
A Professional Review of EBITDA: Waste Management, Inc. Compared to Verisk Analytics, Inc.
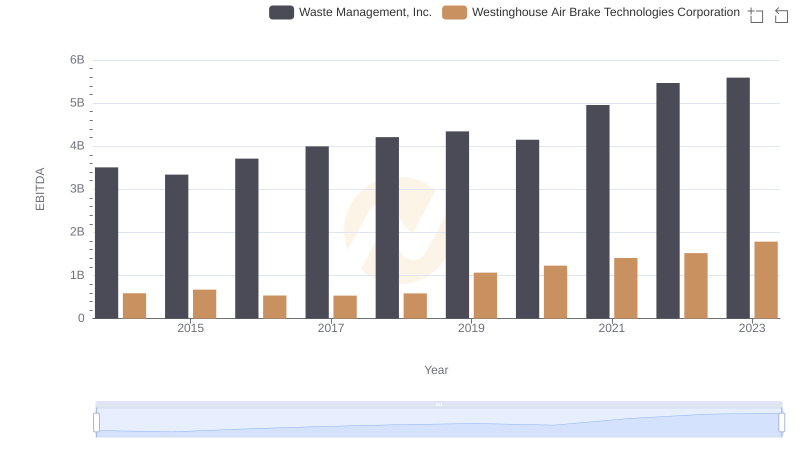
A Professional Review of EBITDA: Waste Management, Inc. Compared to Westinghouse Air Brake Technologies Corporation