| __timestamp | L3Harris Technologies, Inc. | Waste Management, Inc. |
|---|---|---|
| Wednesday, January 1, 2014 | 879000000 | 3509000000 |
| Thursday, January 1, 2015 | 1356000000 | 3342000000 |
| Friday, January 1, 2016 | 1350000000 | 3713000000 |
| Sunday, January 1, 2017 | 1356000000 | 3996000000 |
| Monday, January 1, 2018 | 1538000000 | 4212000000 |
| Tuesday, January 1, 2019 | 2980000000 | 4344000000 |
| Wednesday, January 1, 2020 | 2639000000 | 4149000000 |
| Friday, January 1, 2021 | 3518000000 | 4956000000 |
| Saturday, January 1, 2022 | 2499000000 | 5466000000 |
| Sunday, January 1, 2023 | 2932000000 | 5592000000 |
| Monday, January 1, 2024 | 3561000000 | 5128000000 |
Data in motion
In the ever-evolving landscape of corporate finance, EBITDA serves as a crucial indicator of a company's operational efficiency. Over the past decade, Waste Management, Inc. and L3Harris Technologies, Inc. have demonstrated distinct trajectories in their EBITDA performance. From 2014 to 2023, Waste Management's EBITDA surged by approximately 59%, reflecting its robust growth strategy and market adaptability. In contrast, L3Harris Technologies experienced a more modest increase of around 233%, highlighting its strategic mergers and acquisitions.
This analysis underscores the importance of strategic planning and market positioning in achieving sustainable financial growth.
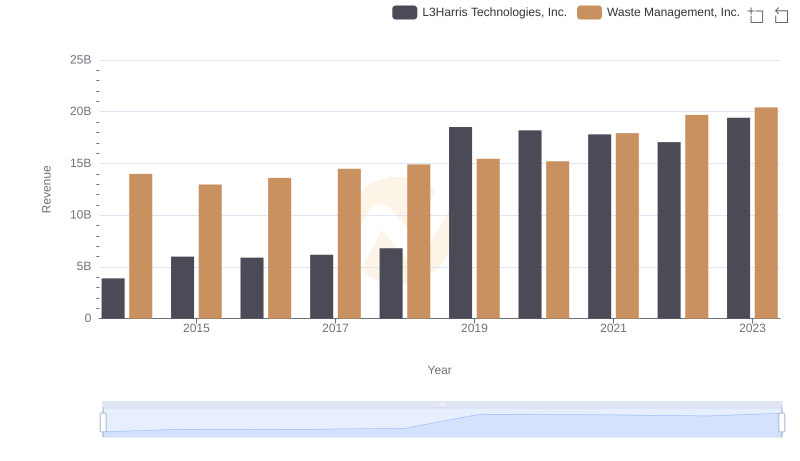
Waste Management, Inc. vs L3Harris Technologies, Inc.: Annual Revenue Growth Compared
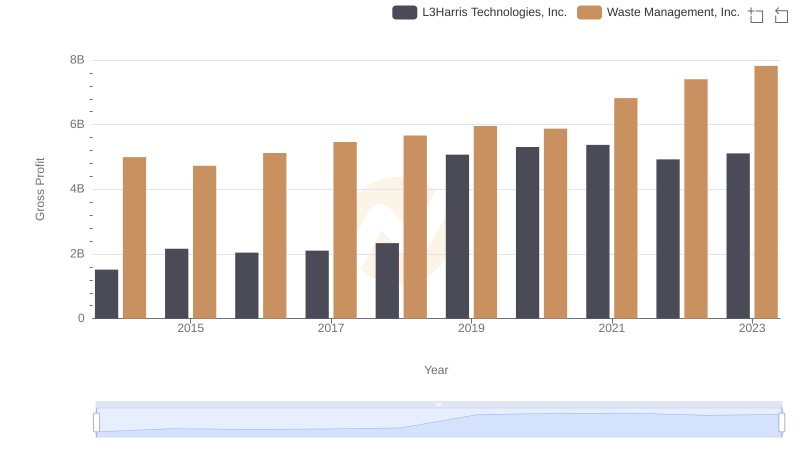
Who Generates Higher Gross Profit? Waste Management, Inc. or L3Harris Technologies, Inc.
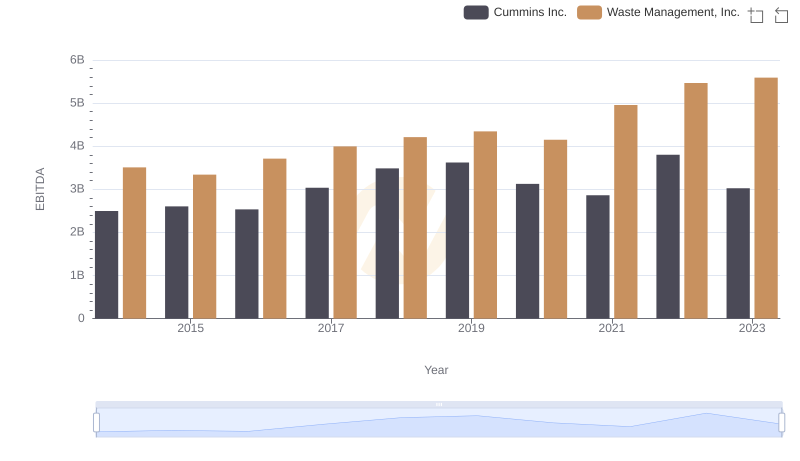
EBITDA Metrics Evaluated: Waste Management, Inc. vs Cummins Inc.
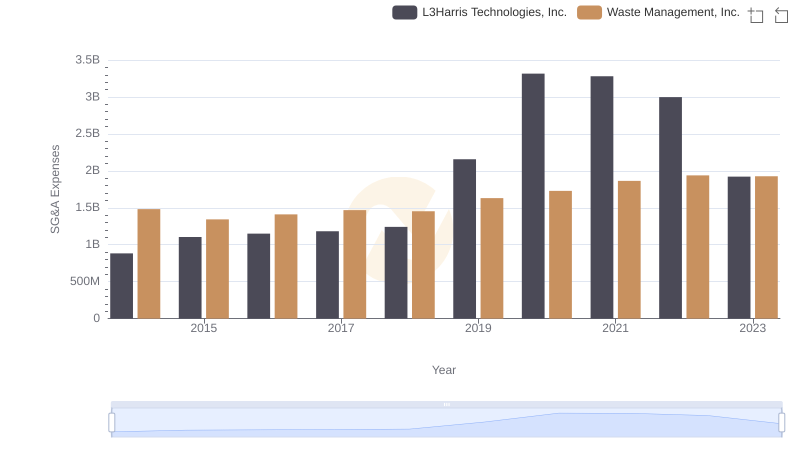
Selling, General, and Administrative Costs: Waste Management, Inc. vs L3Harris Technologies, Inc.
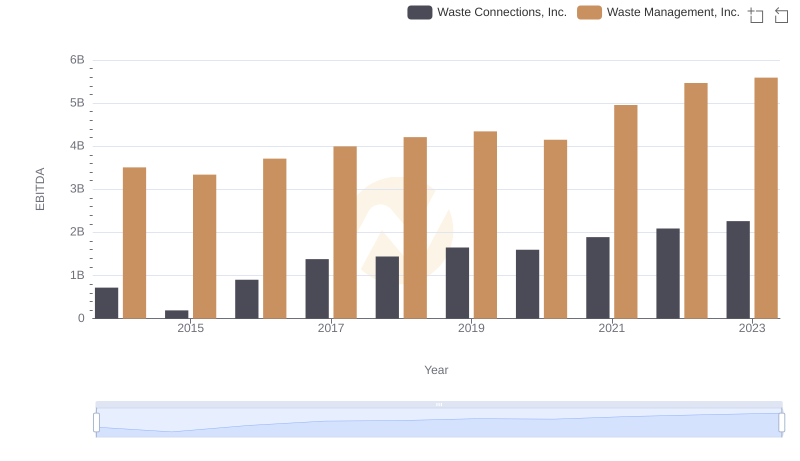
A Side-by-Side Analysis of EBITDA: Waste Management, Inc. and Waste Connections, Inc.
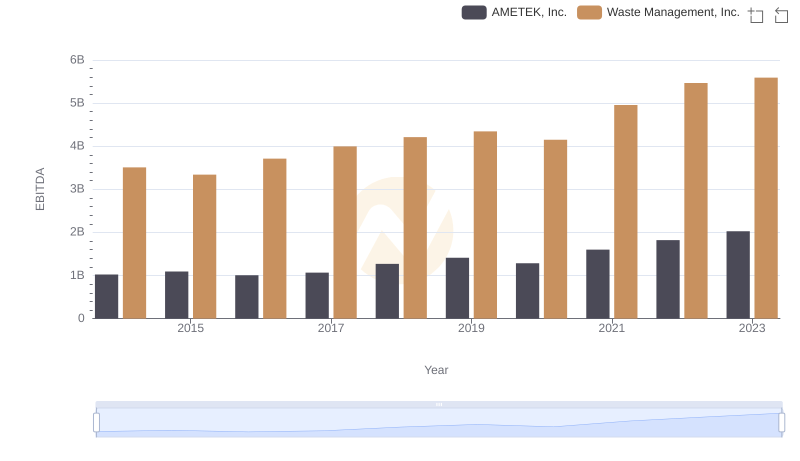
Comprehensive EBITDA Comparison: Waste Management, Inc. vs AMETEK, Inc.
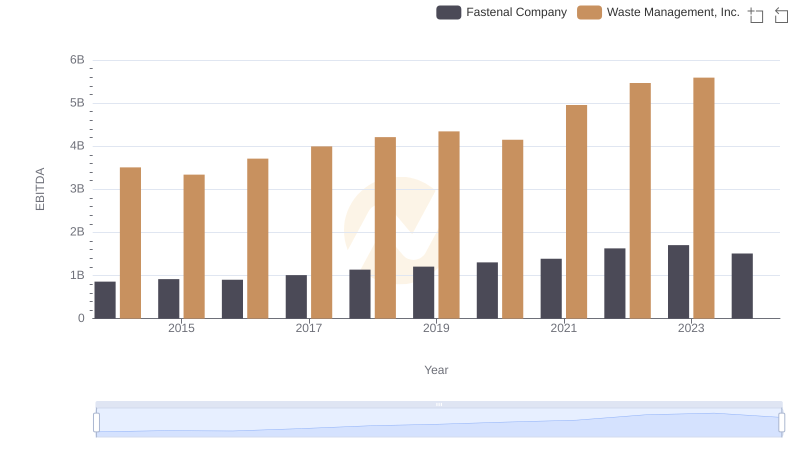
EBITDA Analysis: Evaluating Waste Management, Inc. Against Fastenal Company
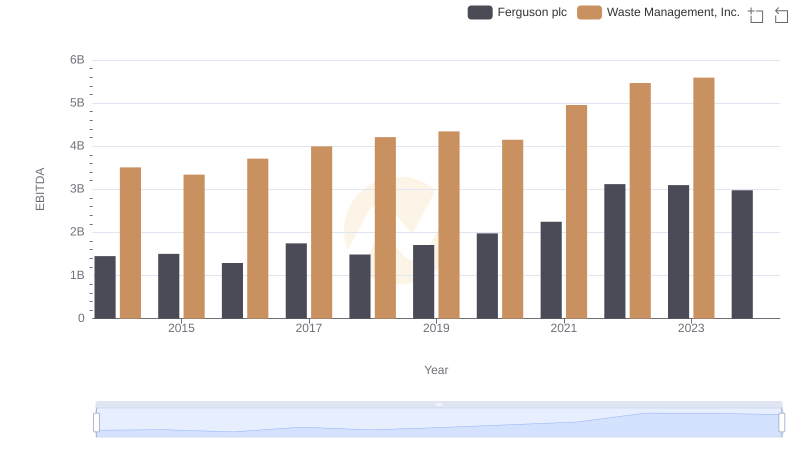
Waste Management, Inc. and Ferguson plc: A Detailed Examination of EBITDA Performance
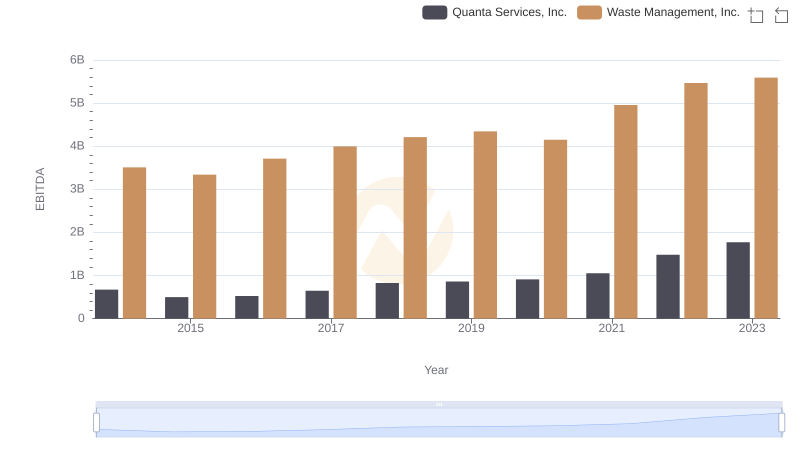
Professional EBITDA Benchmarking: Waste Management, Inc. vs Quanta Services, Inc.
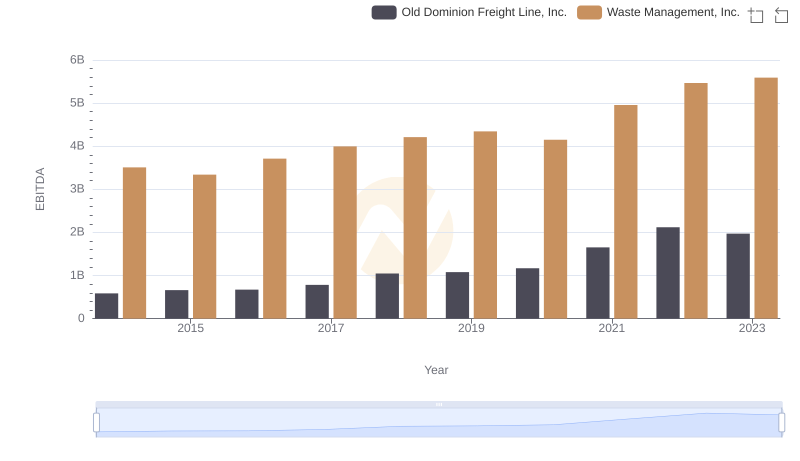
A Professional Review of EBITDA: Waste Management, Inc. Compared to Old Dominion Freight Line, Inc.
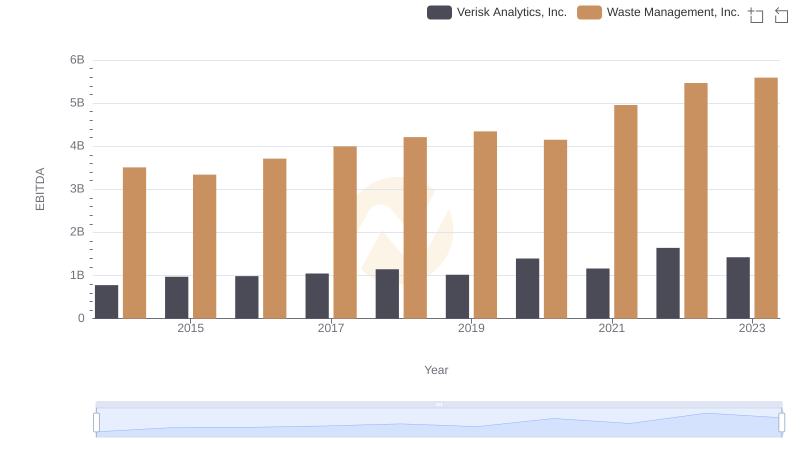
A Professional Review of EBITDA: Waste Management, Inc. Compared to Verisk Analytics, Inc.