| __timestamp | AMETEK, Inc. | Waste Management, Inc. |
|---|---|---|
| Wednesday, January 1, 2014 | 1023344000 | 3509000000 |
| Thursday, January 1, 2015 | 1093776000 | 3342000000 |
| Friday, January 1, 2016 | 1007213000 | 3713000000 |
| Sunday, January 1, 2017 | 1068174000 | 3996000000 |
| Monday, January 1, 2018 | 1269415000 | 4212000000 |
| Tuesday, January 1, 2019 | 1411422000 | 4344000000 |
| Wednesday, January 1, 2020 | 1283159000 | 4149000000 |
| Friday, January 1, 2021 | 1600782000 | 4956000000 |
| Saturday, January 1, 2022 | 1820119000 | 5466000000 |
| Sunday, January 1, 2023 | 2025843000 | 5592000000 |
| Monday, January 1, 2024 | 1779562000 | 5128000000 |
Unveiling the hidden dimensions of data
In the ever-evolving landscape of corporate finance, EBITDA serves as a crucial indicator of a company's operational efficiency. Over the past decade, Waste Management, Inc. and AMETEK, Inc. have demonstrated remarkable growth in this metric. From 2014 to 2023, Waste Management's EBITDA surged by approximately 59%, reflecting its robust business model and strategic expansions. Meanwhile, AMETEK, a leader in electronic instruments, saw its EBITDA nearly double, showcasing its adaptability and innovation in a competitive market.
This comparison not only highlights the financial health of these giants but also offers a glimpse into their strategic foresight.
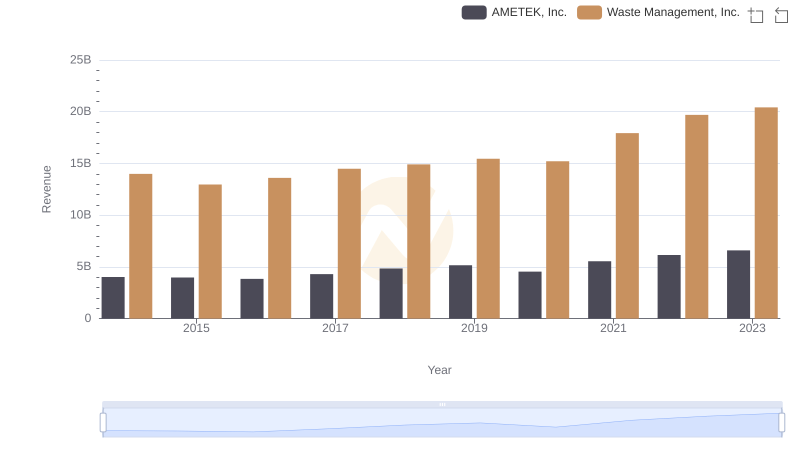
Waste Management, Inc. and AMETEK, Inc.: A Comprehensive Revenue Analysis
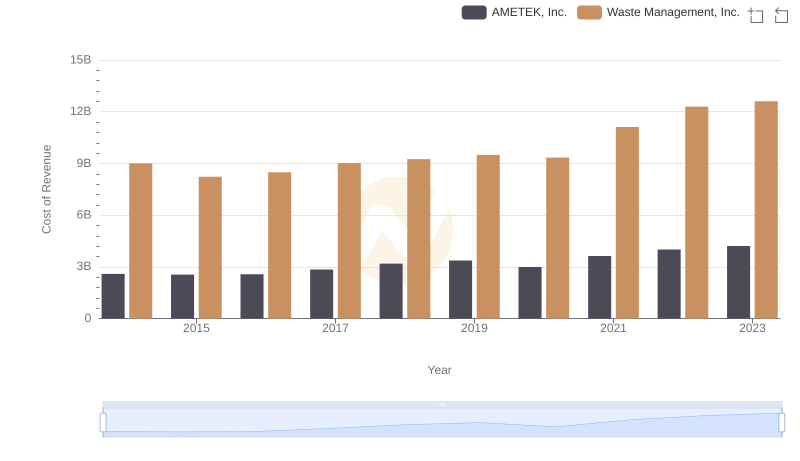
Waste Management, Inc. vs AMETEK, Inc.: Efficiency in Cost of Revenue Explored
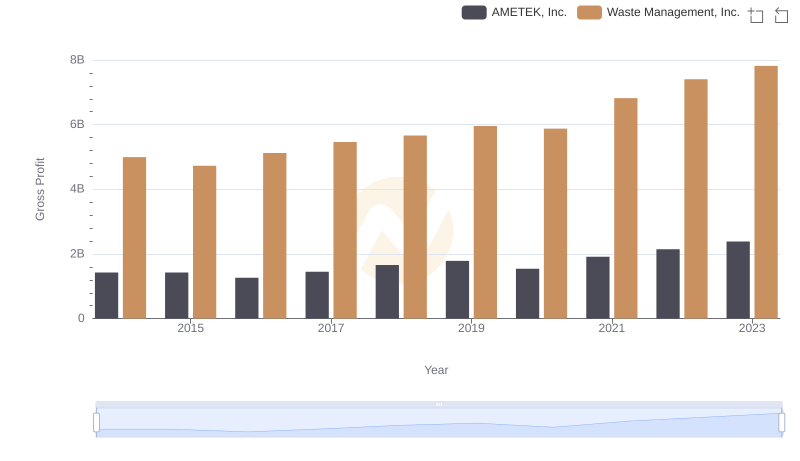
Waste Management, Inc. and AMETEK, Inc.: A Detailed Gross Profit Analysis
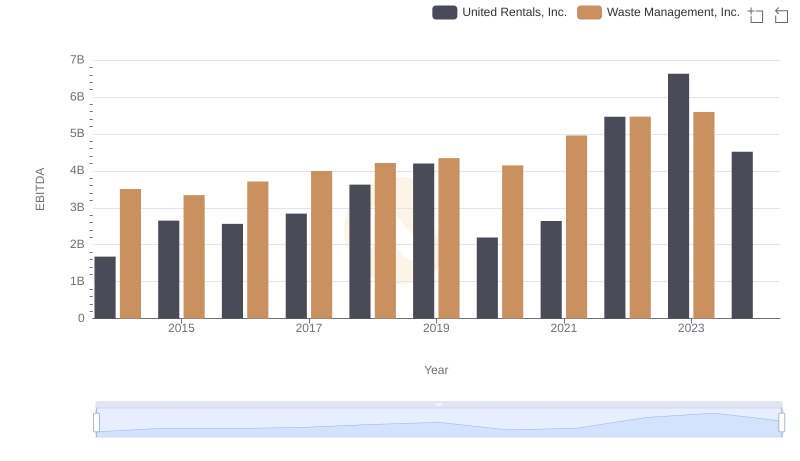
Comprehensive EBITDA Comparison: Waste Management, Inc. vs United Rentals, Inc.
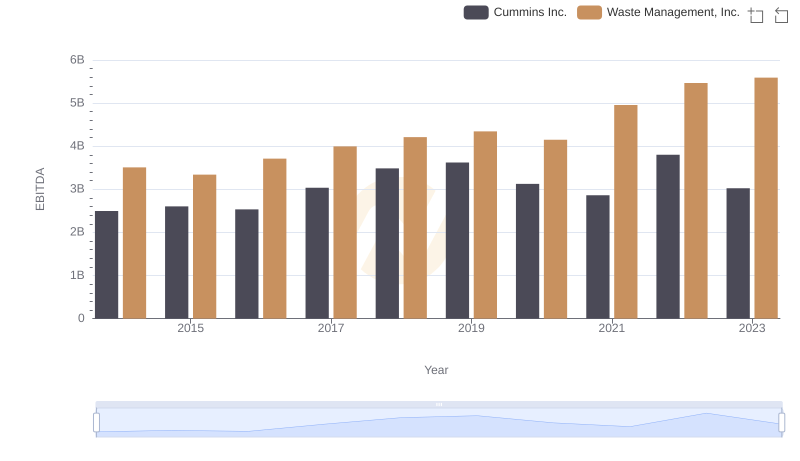
EBITDA Metrics Evaluated: Waste Management, Inc. vs Cummins Inc.
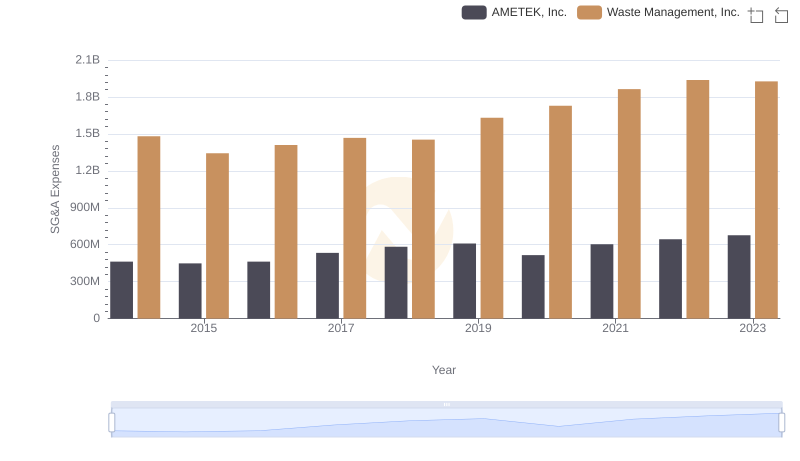
SG&A Efficiency Analysis: Comparing Waste Management, Inc. and AMETEK, Inc.
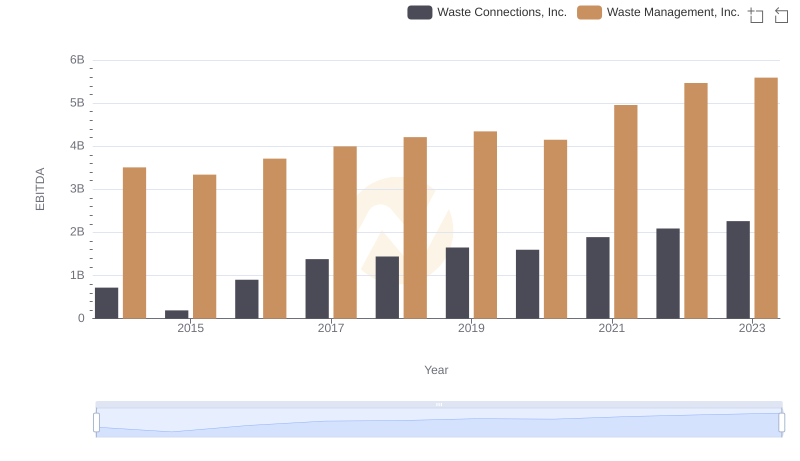
A Side-by-Side Analysis of EBITDA: Waste Management, Inc. and Waste Connections, Inc.
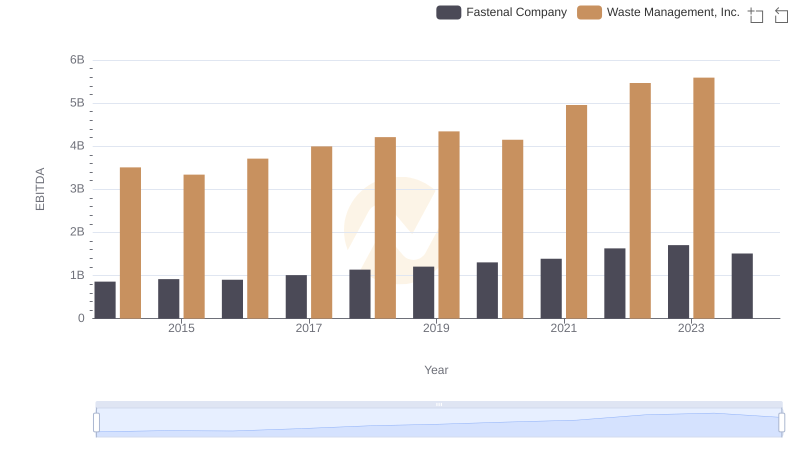
EBITDA Analysis: Evaluating Waste Management, Inc. Against Fastenal Company
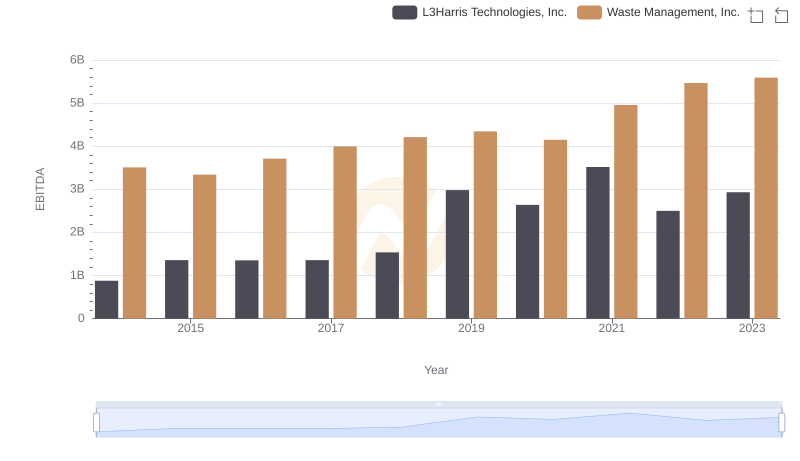
Waste Management, Inc. and L3Harris Technologies, Inc.: A Detailed Examination of EBITDA Performance
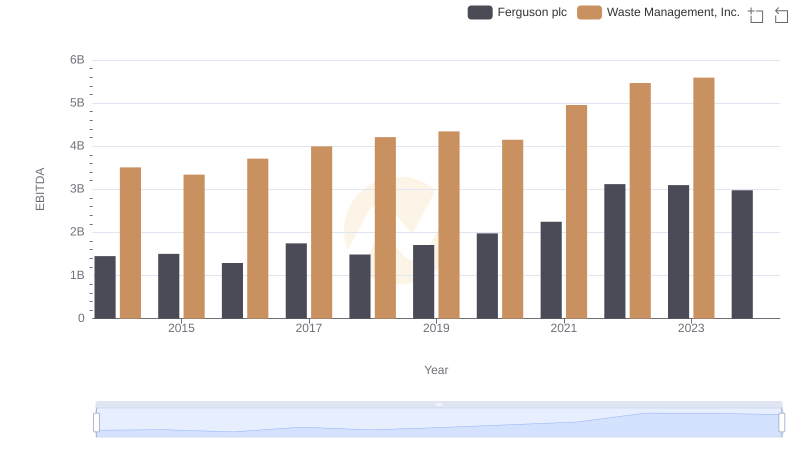
Waste Management, Inc. and Ferguson plc: A Detailed Examination of EBITDA Performance
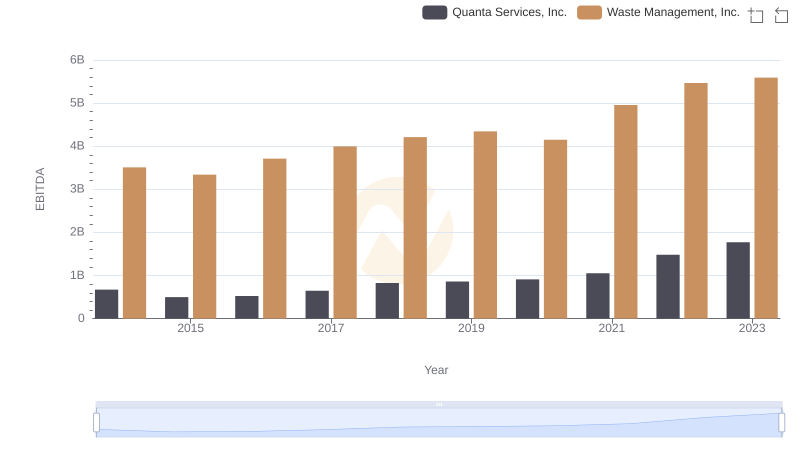
Professional EBITDA Benchmarking: Waste Management, Inc. vs Quanta Services, Inc.
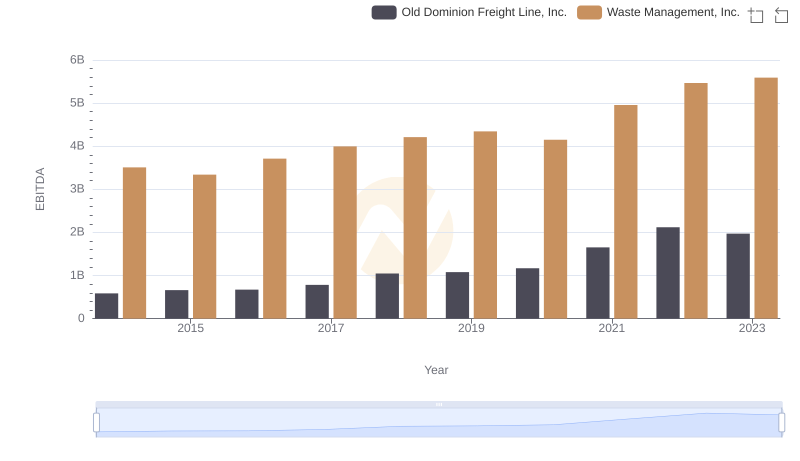
A Professional Review of EBITDA: Waste Management, Inc. Compared to Old Dominion Freight Line, Inc.