| __timestamp | Expeditors International of Washington, Inc. | Rockwell Automation, Inc. |
|---|---|---|
| Wednesday, January 1, 2014 | 643940000 | 1346000000 |
| Thursday, January 1, 2015 | 767496000 | 1359100000 |
| Friday, January 1, 2016 | 716959000 | 1200700000 |
| Sunday, January 1, 2017 | 749570000 | 1258400000 |
| Monday, January 1, 2018 | 850582000 | 1568400000 |
| Tuesday, January 1, 2019 | 817642000 | 1150200000 |
| Wednesday, January 1, 2020 | 1013523000 | 1410200000 |
| Friday, January 1, 2021 | 1975928000 | 1808300000 |
| Saturday, January 1, 2022 | 1916506000 | 1432100000 |
| Sunday, January 1, 2023 | 1087588000 | 1990700000 |
| Monday, January 1, 2024 | 1154330000 | 1567500000 |
Igniting the spark of knowledge
In the ever-evolving landscape of industrial automation and logistics, understanding financial health is crucial. This analysis delves into the EBITDA performance of Rockwell Automation, Inc. and Expeditors International of Washington, Inc. from 2014 to 2023. Over this period, Rockwell Automation consistently outperformed Expeditors, with an average EBITDA approximately 39% higher. Notably, in 2023, Rockwell Automation reached its peak EBITDA, marking a 48% increase from its 2019 low. Meanwhile, Expeditors experienced a significant surge in 2021, with EBITDA nearly doubling from the previous year, highlighting its resilience amidst global supply chain challenges. However, the data for 2024 is incomplete, leaving room for speculation on future trends. This financial journey underscores the dynamic nature of these industries and the importance of strategic financial management.
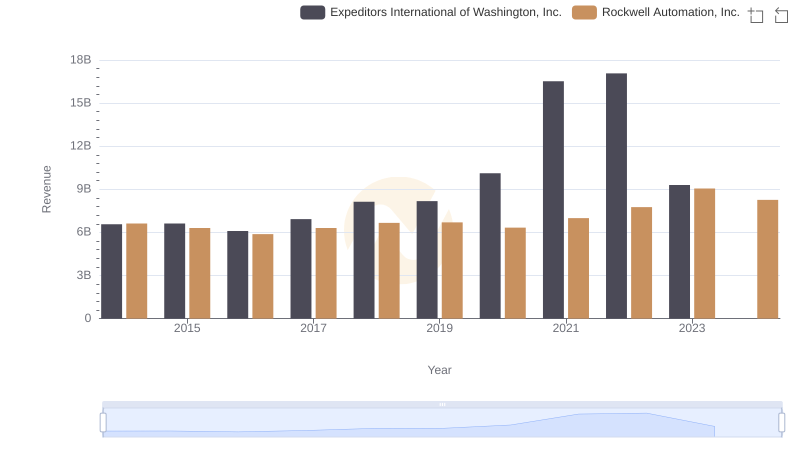
Comparing Revenue Performance: Rockwell Automation, Inc. or Expeditors International of Washington, Inc.?
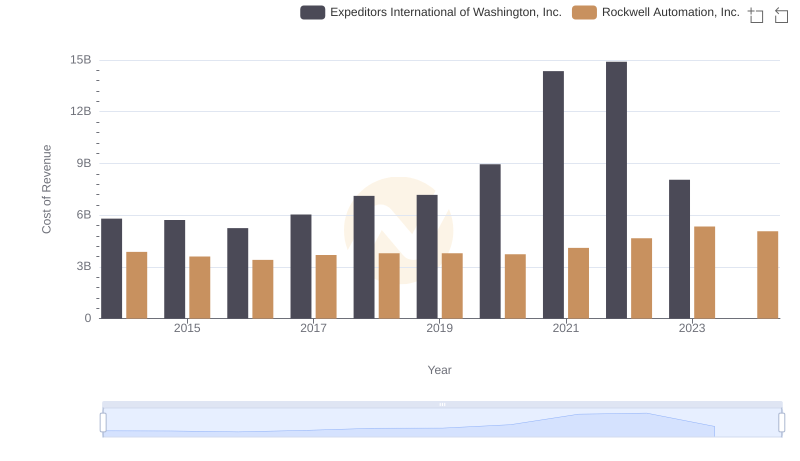
Analyzing Cost of Revenue: Rockwell Automation, Inc. and Expeditors International of Washington, Inc.

Gross Profit Comparison: Rockwell Automation, Inc. and Expeditors International of Washington, Inc. Trends
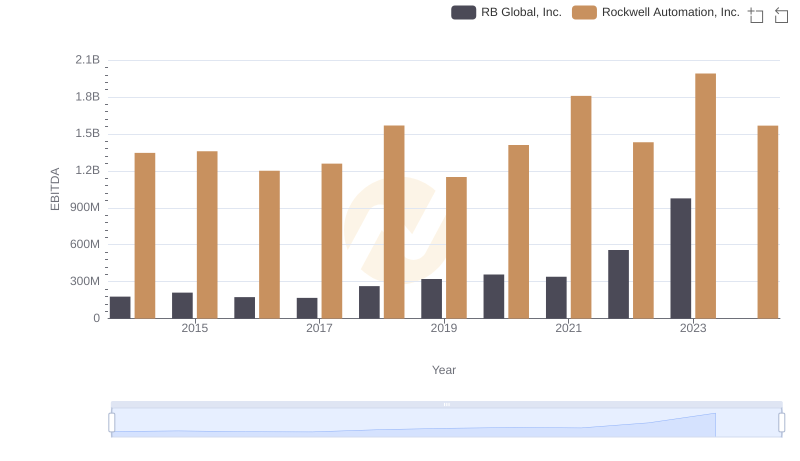
Rockwell Automation, Inc. and RB Global, Inc.: A Detailed Examination of EBITDA Performance

Cost Management Insights: SG&A Expenses for Rockwell Automation, Inc. and Expeditors International of Washington, Inc.
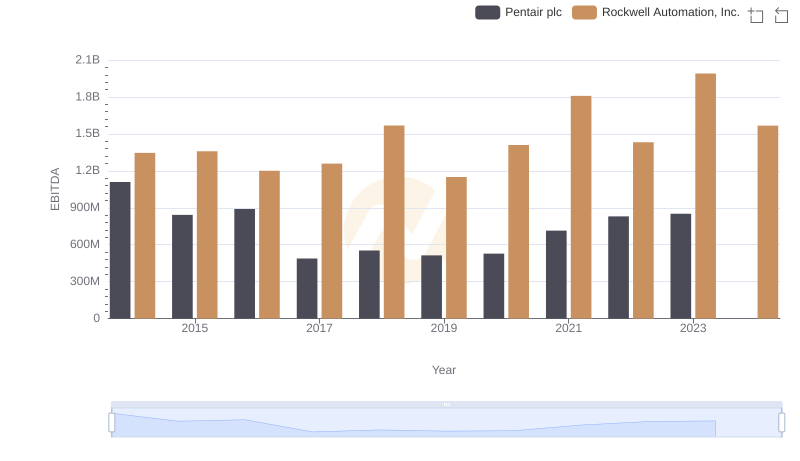
Comprehensive EBITDA Comparison: Rockwell Automation, Inc. vs Pentair plc
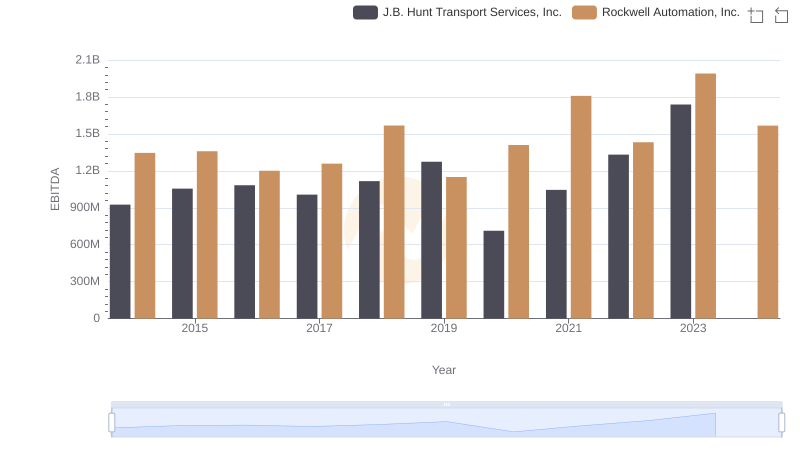
Rockwell Automation, Inc. and J.B. Hunt Transport Services, Inc.: A Detailed Examination of EBITDA Performance
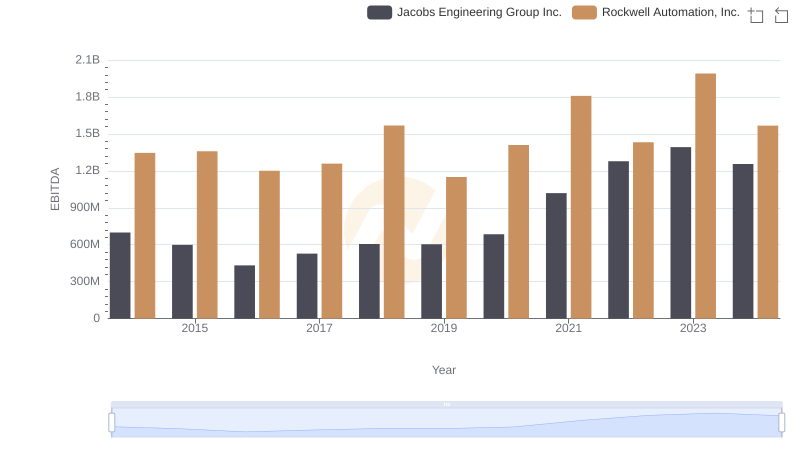
Rockwell Automation, Inc. vs Jacobs Engineering Group Inc.: In-Depth EBITDA Performance Comparison

Comprehensive EBITDA Comparison: Rockwell Automation, Inc. vs XPO Logistics, Inc.
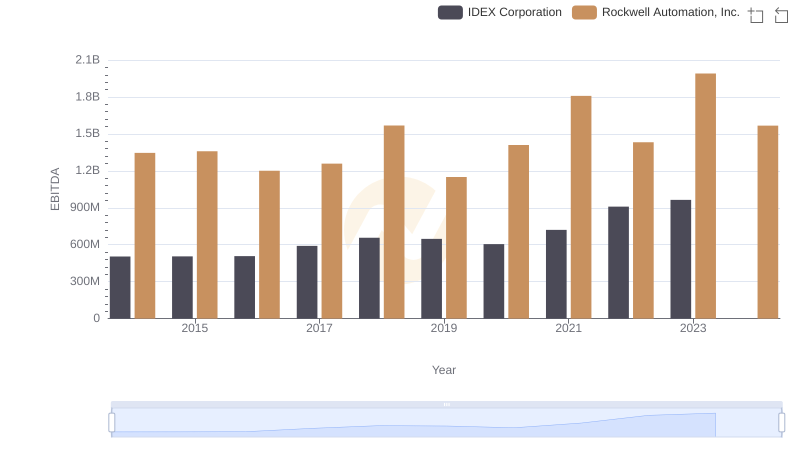
Rockwell Automation, Inc. vs IDEX Corporation: In-Depth EBITDA Performance Comparison
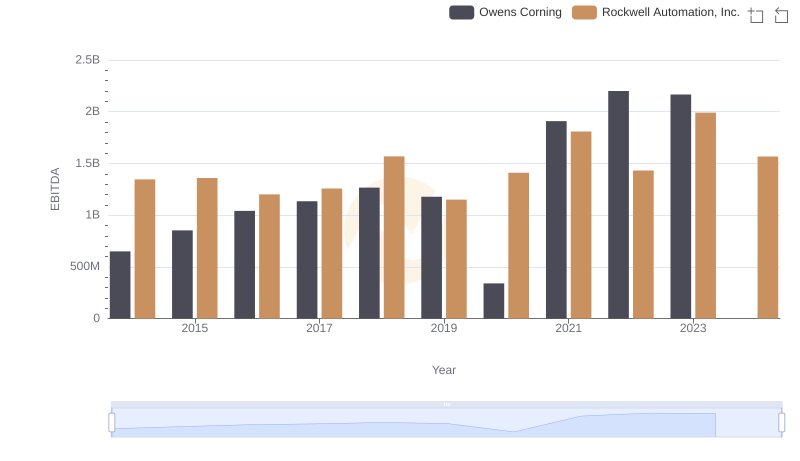
EBITDA Analysis: Evaluating Rockwell Automation, Inc. Against Owens Corning