| __timestamp | Builders FirstSource, Inc. | Rockwell Automation, Inc. |
|---|---|---|
| Wednesday, January 1, 2014 | 306508000 | 1570100000 |
| Thursday, January 1, 2015 | 810841000 | 1506400000 |
| Friday, January 1, 2016 | 1360412000 | 1467400000 |
| Sunday, January 1, 2017 | 1442288000 | 1591500000 |
| Monday, January 1, 2018 | 1553972000 | 1599000000 |
| Tuesday, January 1, 2019 | 1584523000 | 1538500000 |
| Wednesday, January 1, 2020 | 1678730000 | 1479800000 |
| Friday, January 1, 2021 | 3463532000 | 1680000000 |
| Saturday, January 1, 2022 | 3974173000 | 1766700000 |
| Sunday, January 1, 2023 | 3836015000 | 2023700000 |
| Monday, January 1, 2024 | 2002600000 |
Unleashing insights
In the ever-evolving landscape of industrial automation and building materials, understanding operational costs is crucial. Over the past decade, Rockwell Automation, Inc. and Builders FirstSource, Inc. have shown distinct trends in their Selling, General, and Administrative (SG&A) expenses. From 2014 to 2023, Builders FirstSource saw a staggering increase of over 1,150% in SG&A expenses, peaking in 2022. This surge reflects their aggressive expansion and market adaptation strategies. In contrast, Rockwell Automation's SG&A expenses grew modestly by about 29% over the same period, indicating a more stable operational approach. Notably, 2023 marked a year where Rockwell's expenses reached their highest, suggesting strategic investments or market shifts. While Builders FirstSource's data for 2024 remains elusive, Rockwell's slight dip hints at potential cost optimizations. These insights offer a window into the strategic priorities of these industry giants.
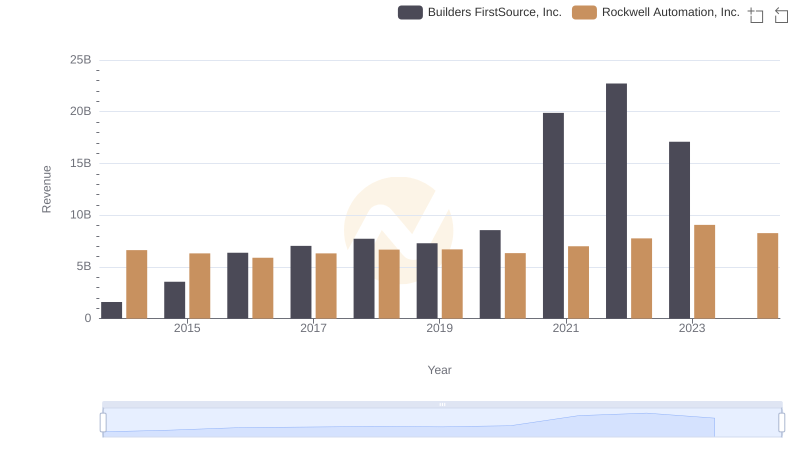
Revenue Insights: Rockwell Automation, Inc. and Builders FirstSource, Inc. Performance Compared
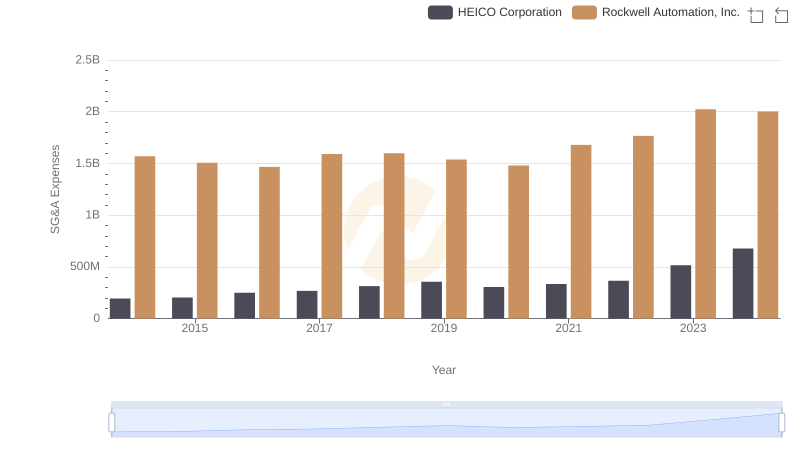
Comparing SG&A Expenses: Rockwell Automation, Inc. vs HEICO Corporation Trends and Insights
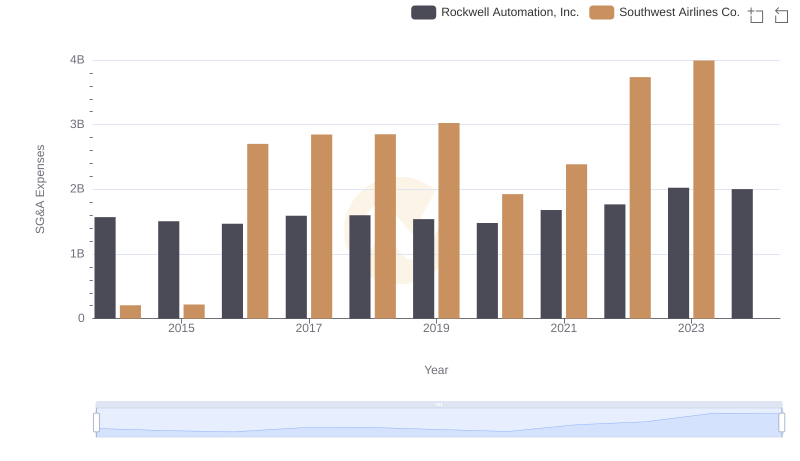
Rockwell Automation, Inc. and Southwest Airlines Co.: SG&A Spending Patterns Compared
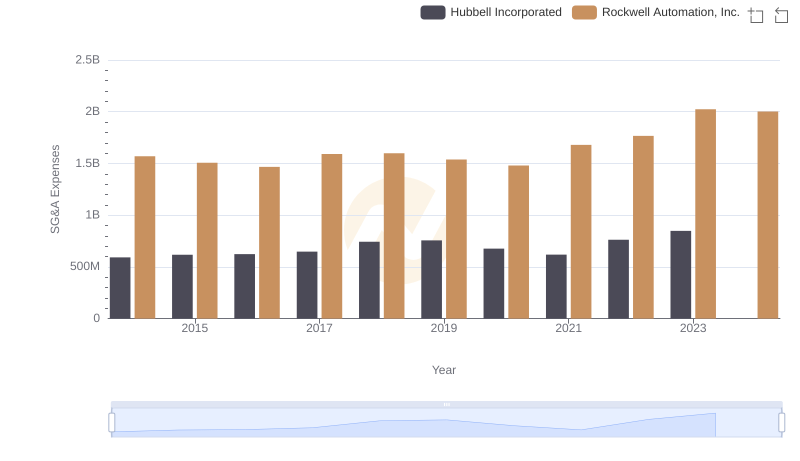
Operational Costs Compared: SG&A Analysis of Rockwell Automation, Inc. and Hubbell Incorporated
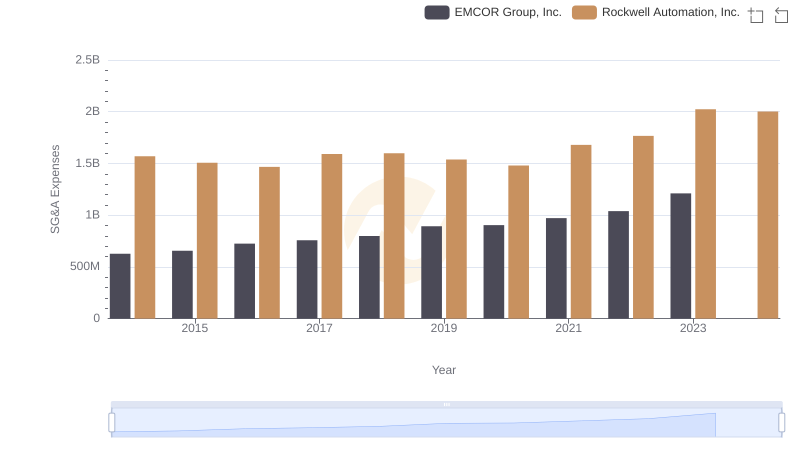
Comparing SG&A Expenses: Rockwell Automation, Inc. vs EMCOR Group, Inc. Trends and Insights
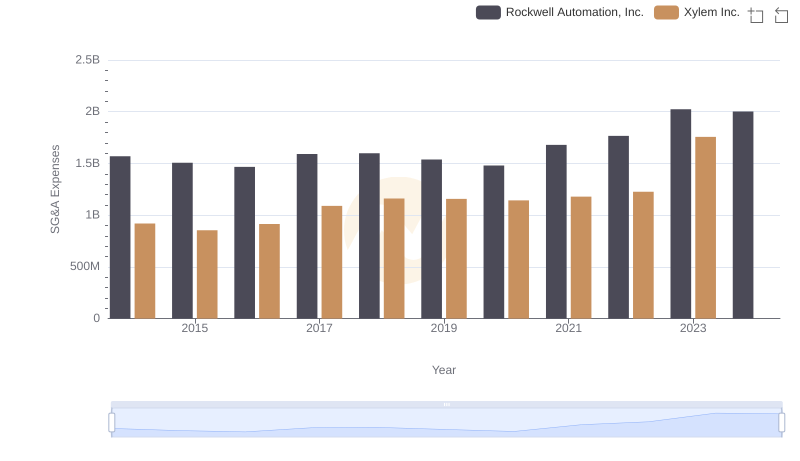
Who Optimizes SG&A Costs Better? Rockwell Automation, Inc. or Xylem Inc.
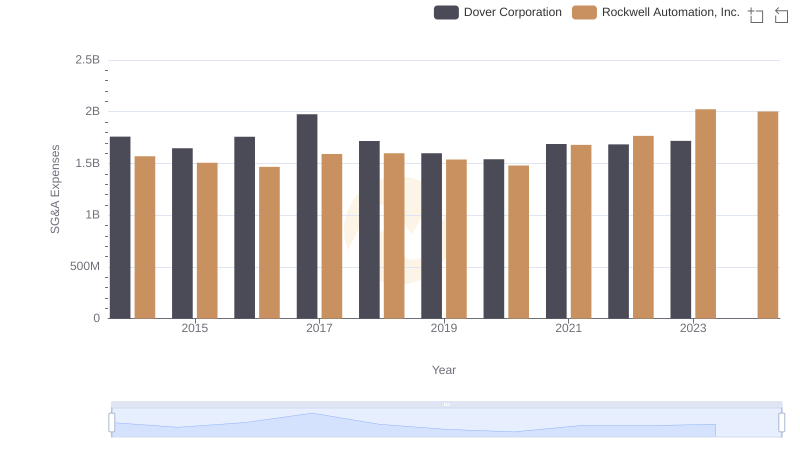
Cost Management Insights: SG&A Expenses for Rockwell Automation, Inc. and Dover Corporation
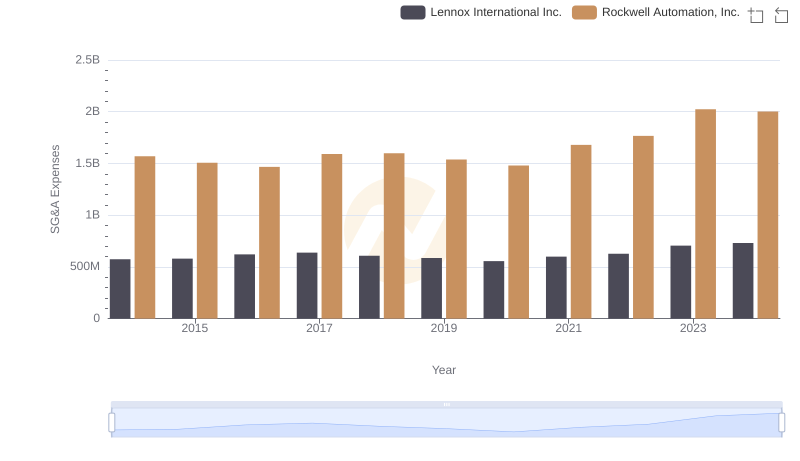
Cost Management Insights: SG&A Expenses for Rockwell Automation, Inc. and Lennox International Inc.
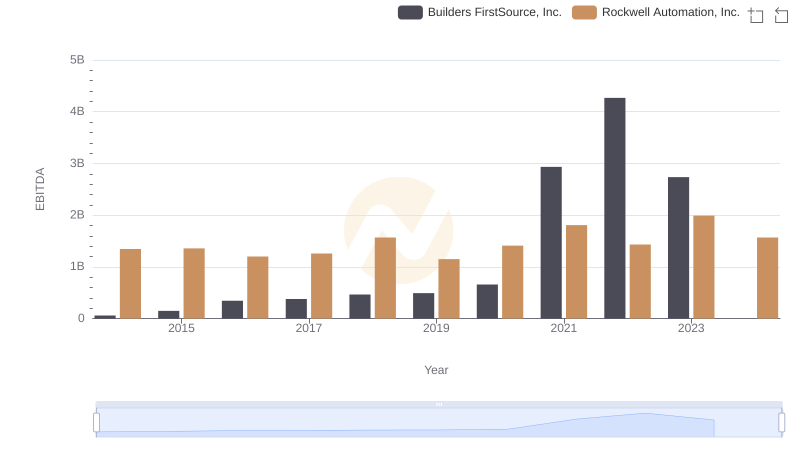
EBITDA Analysis: Evaluating Rockwell Automation, Inc. Against Builders FirstSource, Inc.