| __timestamp | FedEx Corporation | Parker-Hannifin Corporation |
|---|---|---|
| Wednesday, January 1, 2014 | 6036000000 | 1832903000 |
| Thursday, January 1, 2015 | 7141000000 | 1861551000 |
| Friday, January 1, 2016 | 7531000000 | 1558088000 |
| Sunday, January 1, 2017 | 8093000000 | 1846306000 |
| Monday, January 1, 2018 | 8555000000 | 2382235000 |
| Tuesday, January 1, 2019 | 4934000000 | 2513468000 |
| Wednesday, January 1, 2020 | 6345000000 | 2431500000 |
| Friday, January 1, 2021 | 11749000000 | 3092383000 |
| Saturday, January 1, 2022 | 9767000000 | 2441242000 |
| Sunday, January 1, 2023 | 10603000000 | 4071687000 |
| Monday, January 1, 2024 | 10868000000 | 5028229000 |
Igniting the spark of knowledge
In the ever-evolving landscape of industrial and logistics sectors, Parker-Hannifin Corporation and FedEx Corporation stand as titans. Over the past decade, from 2014 to 2024, these companies have showcased remarkable financial trajectories. FedEx, a global leader in logistics, has seen its EBITDA grow by approximately 80%, peaking in 2021 with a staggering 11.7 billion. Meanwhile, Parker-Hannifin, a key player in motion and control technologies, has experienced a more modest yet steady growth of around 175%, reaching its highest EBITDA of 5 billion in 2024.
This side-by-side analysis highlights the resilience and adaptability of these corporations. While FedEx's EBITDA dipped in 2019, it rebounded strongly, underscoring its robust business model. Parker-Hannifin's consistent growth reflects its strategic expansions and innovations. As we look to the future, these trends offer valuable insights into the financial health and strategic directions of these industry leaders.

Breaking Down Revenue Trends: Parker-Hannifin Corporation vs FedEx Corporation
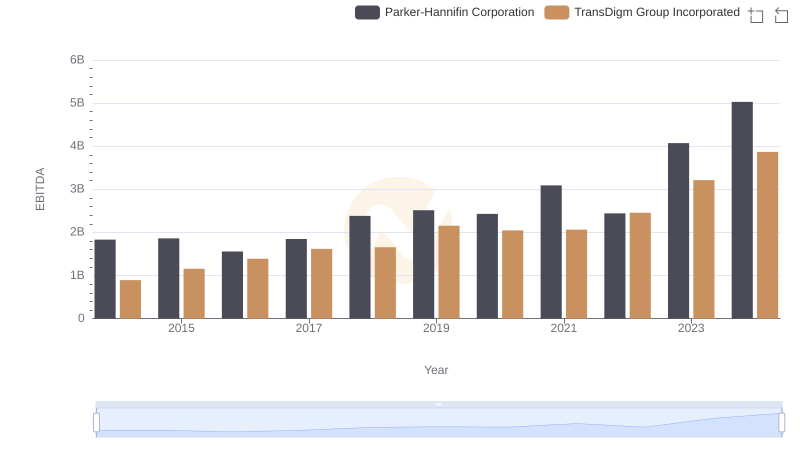
A Professional Review of EBITDA: Parker-Hannifin Corporation Compared to TransDigm Group Incorporated
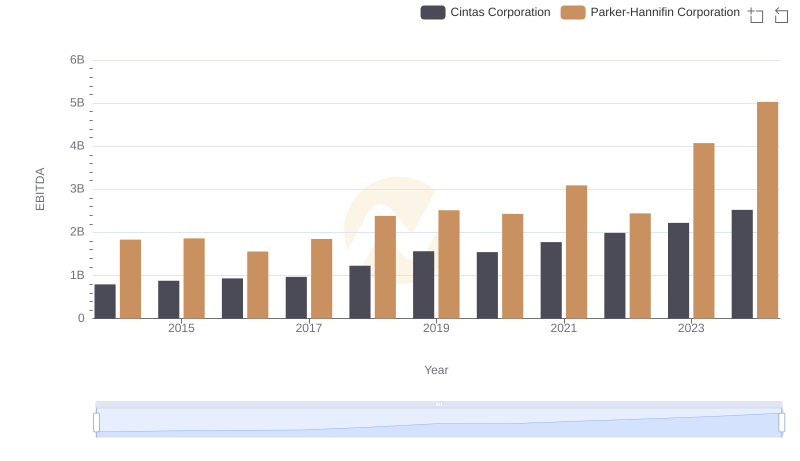
A Side-by-Side Analysis of EBITDA: Parker-Hannifin Corporation and Cintas Corporation
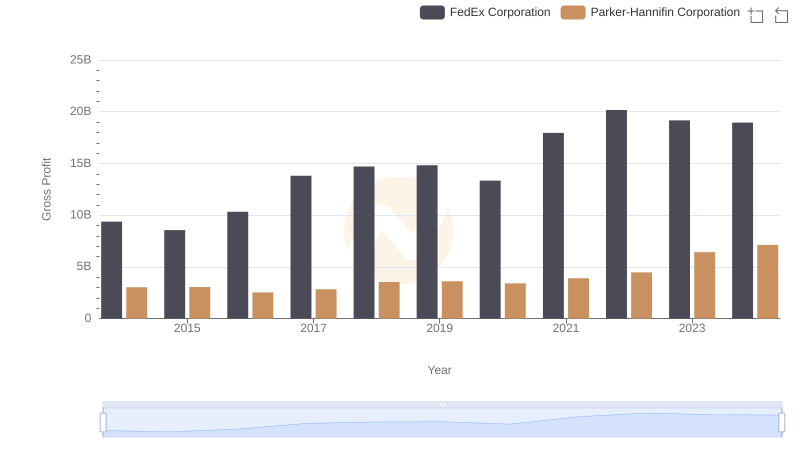
Gross Profit Comparison: Parker-Hannifin Corporation and FedEx Corporation Trends
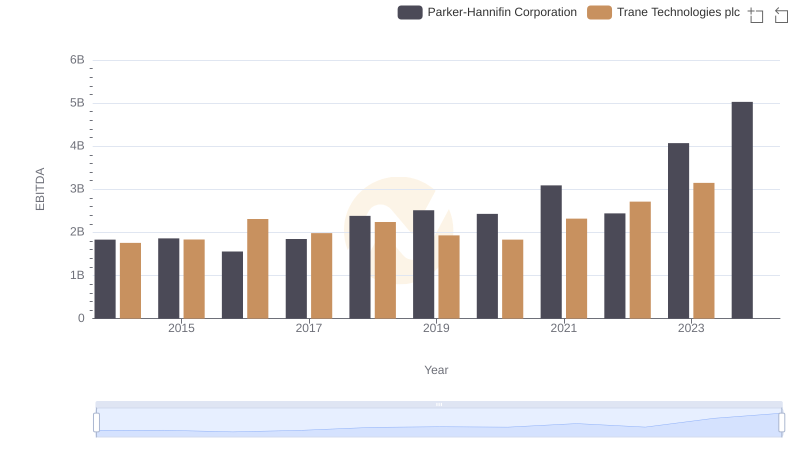
EBITDA Analysis: Evaluating Parker-Hannifin Corporation Against Trane Technologies plc

EBITDA Metrics Evaluated: Parker-Hannifin Corporation vs Illinois Tool Works Inc.
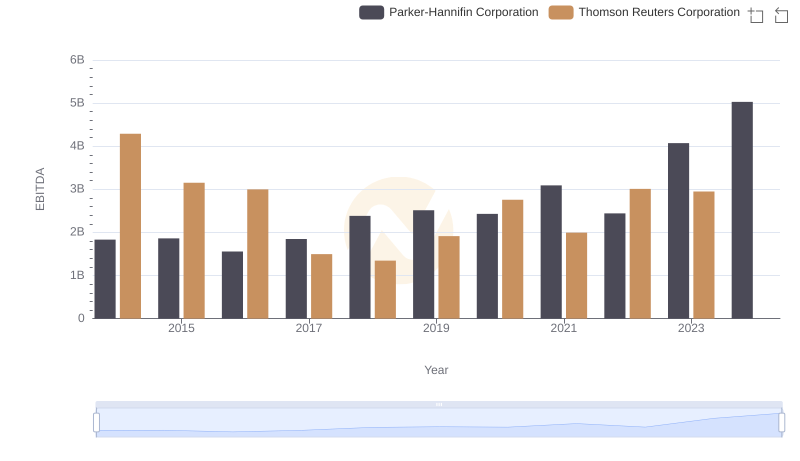
Parker-Hannifin Corporation vs Thomson Reuters Corporation: In-Depth EBITDA Performance Comparison
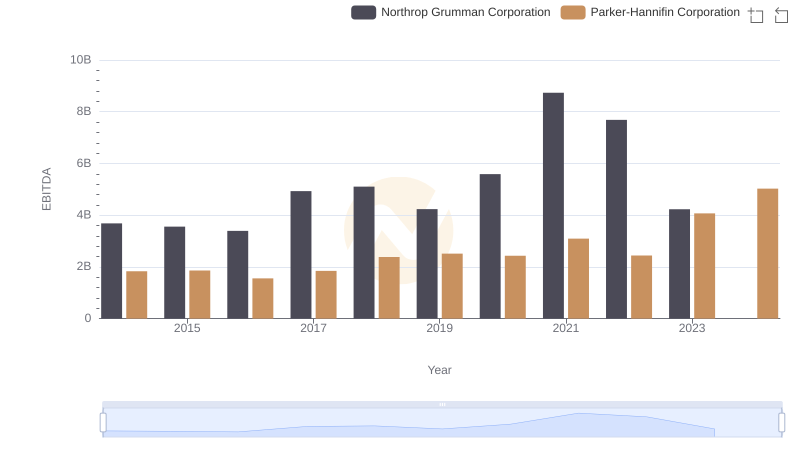
A Side-by-Side Analysis of EBITDA: Parker-Hannifin Corporation and Northrop Grumman Corporation