| __timestamp | International Business Machines Corporation | NetApp, Inc. |
|---|---|---|
| Wednesday, January 1, 2014 | 24962000000 | 1110900000 |
| Thursday, January 1, 2015 | 20268000000 | 1023700000 |
| Friday, January 1, 2016 | 17341000000 | 662000000 |
| Sunday, January 1, 2017 | 16556000000 | 943000000 |
| Monday, January 1, 2018 | 16545000000 | 1459000000 |
| Tuesday, January 1, 2019 | 14609000000 | 1523000000 |
| Wednesday, January 1, 2020 | 10555000000 | 1243000000 |
| Friday, January 1, 2021 | 12409000000 | 1295000000 |
| Saturday, January 1, 2022 | 7174000000 | 1364000000 |
| Sunday, January 1, 2023 | 14693000000 | 1434000000 |
| Monday, January 1, 2024 | 6015000000 | 1582000000 |
In pursuit of knowledge
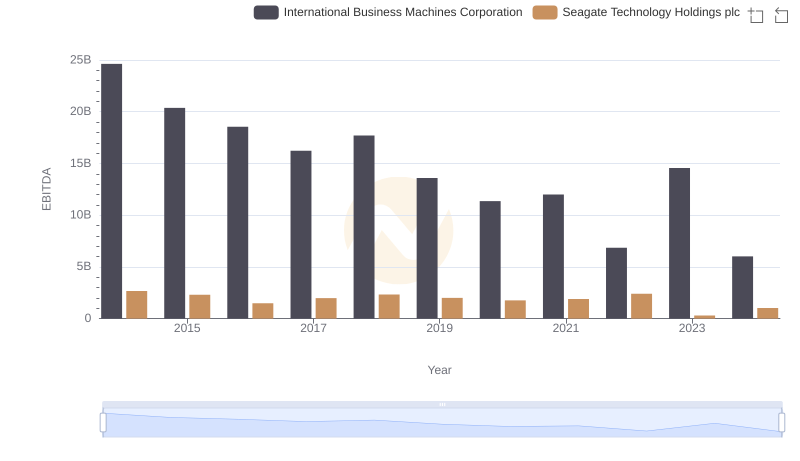
In the ever-evolving tech industry, the financial health of companies like International Business Machines Corporation (IBM) and NetApp, Inc. is crucial. Over the past decade, IBM's EBITDA has seen a significant decline, dropping from its peak in 2014 to nearly 60% less by 2024. This trend reflects the challenges IBM faces in adapting to the rapidly changing tech landscape. In contrast, NetApp has shown a more stable EBITDA performance, with a modest increase of around 42% over the same period. This stability highlights NetApp's strategic positioning in the data management sector. The data from 2014 to 2024 provides a compelling narrative of how these two giants have navigated the financial tides, offering insights into their strategic decisions and market adaptability. As we look to the future, these trends may serve as a barometer for their ongoing competitiveness in the tech industry.
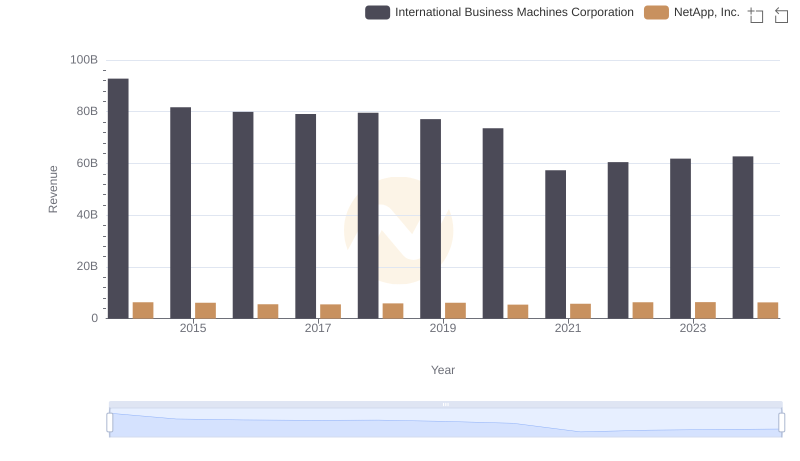
Comparing Revenue Performance: International Business Machines Corporation or NetApp, Inc.?
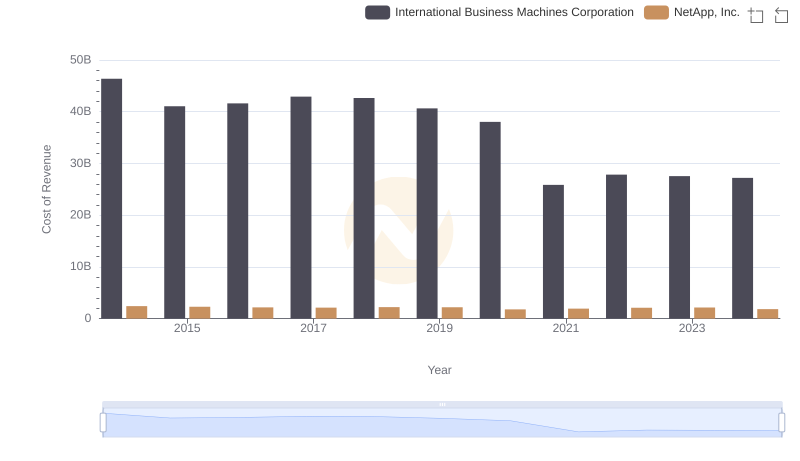
Analyzing Cost of Revenue: International Business Machines Corporation and NetApp, Inc.

Gross Profit Trends Compared: International Business Machines Corporation vs NetApp, Inc.
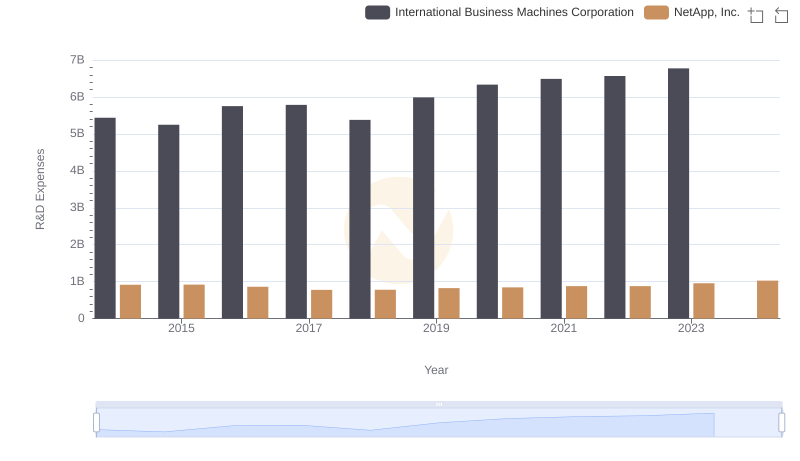
R&D Spending Showdown: International Business Machines Corporation vs NetApp, Inc.
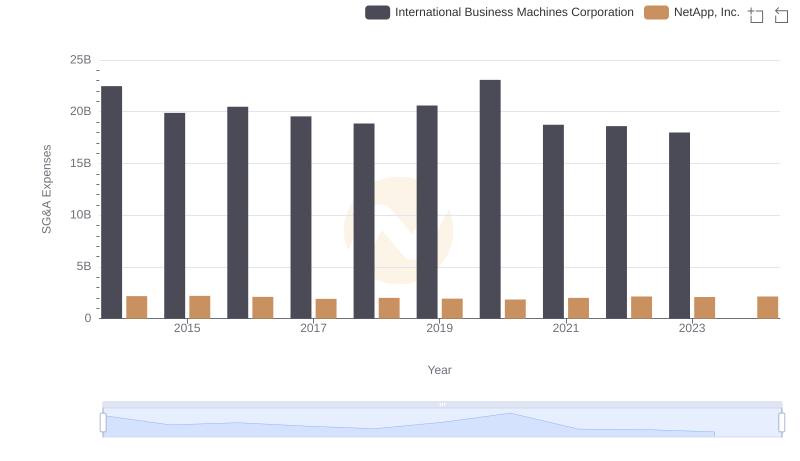
Who Optimizes SG&A Costs Better? International Business Machines Corporation or NetApp, Inc.
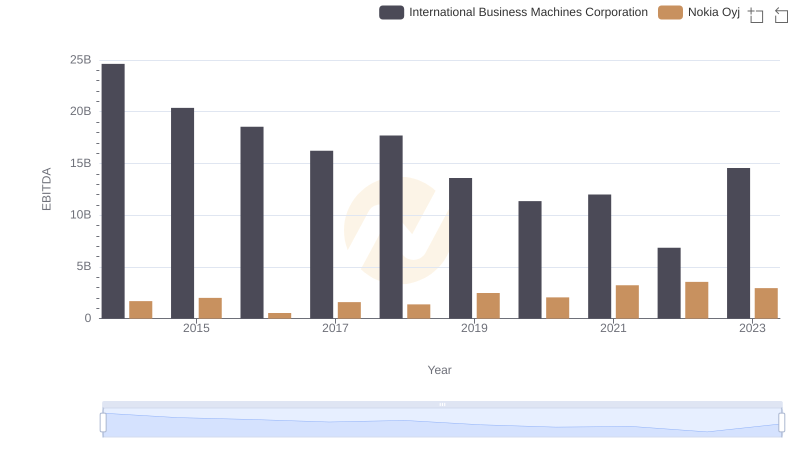
Professional EBITDA Benchmarking: International Business Machines Corporation vs Nokia Oyj
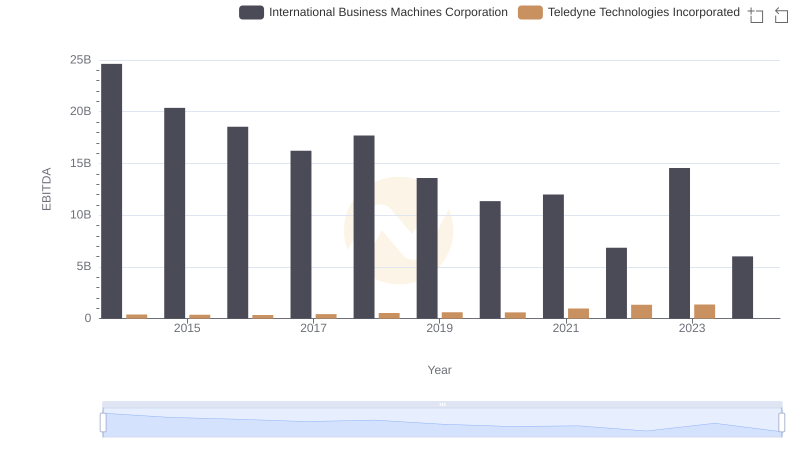
A Professional Review of EBITDA: International Business Machines Corporation Compared to Teledyne Technologies Incorporated

EBITDA Analysis: Evaluating International Business Machines Corporation Against PTC Inc.
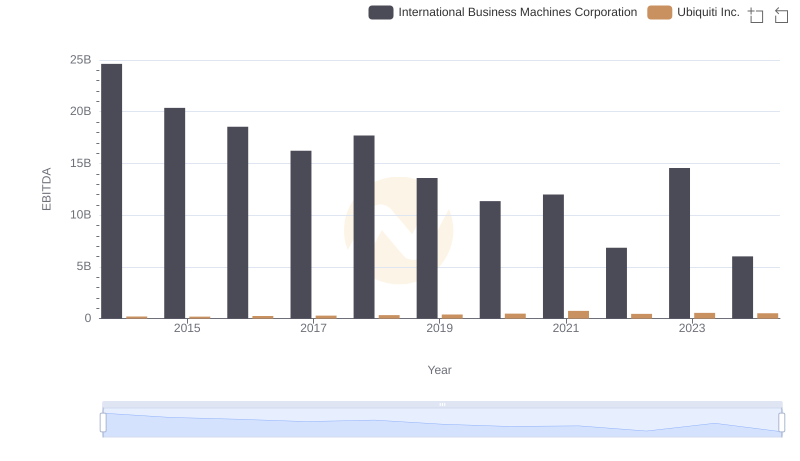
EBITDA Analysis: Evaluating International Business Machines Corporation Against Ubiquiti Inc.
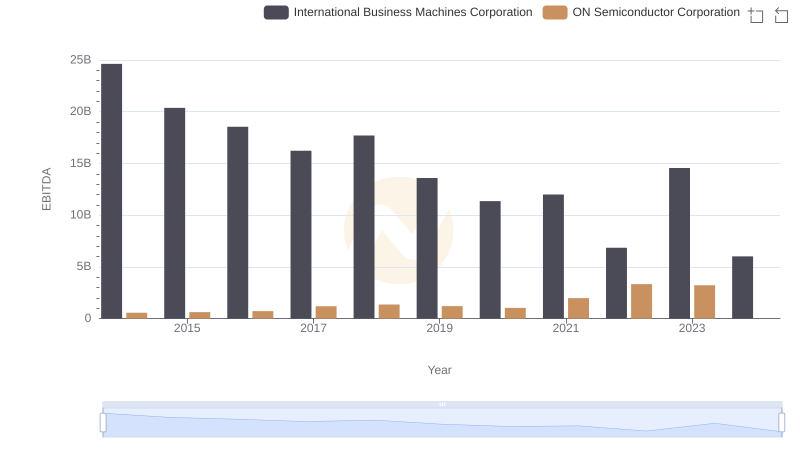
EBITDA Analysis: Evaluating International Business Machines Corporation Against ON Semiconductor Corporation
International Business Machines Corporation vs Seagate Technology Holdings plc: In-Depth EBITDA Performance Comparison

International Business Machines Corporation vs FLEETCOR Technologies, Inc.: In-Depth EBITDA Performance Comparison