| __timestamp | International Business Machines Corporation | ON Semiconductor Corporation |
|---|---|---|
| Wednesday, January 1, 2014 | 24962000000 | 564800000 |
| Thursday, January 1, 2015 | 20268000000 | 631800000 |
| Friday, January 1, 2016 | 17341000000 | 727800000 |
| Sunday, January 1, 2017 | 16556000000 | 1196700000 |
| Monday, January 1, 2018 | 16545000000 | 1366800000 |
| Tuesday, January 1, 2019 | 14609000000 | 1210600000 |
| Wednesday, January 1, 2020 | 10555000000 | 1043400000 |
| Friday, January 1, 2021 | 12409000000 | 1981800000 |
| Saturday, January 1, 2022 | 7174000000 | 3338900000 |
| Sunday, January 1, 2023 | 14693000000 | 3220100000 |
| Monday, January 1, 2024 | 6015000000 | 1767700000 |
Igniting the spark of knowledge
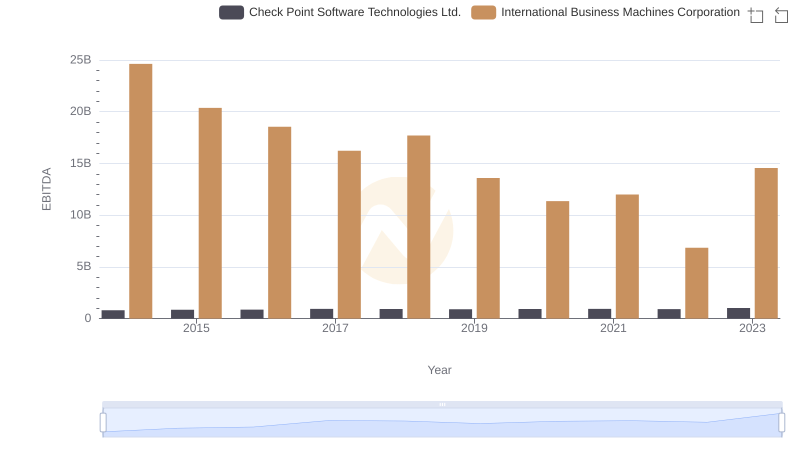
In the ever-evolving landscape of technology, understanding financial health is crucial. This analysis delves into the EBITDA performance of International Business Machines Corporation (IBM) and ON Semiconductor Corporation from 2014 to 2023. Over this decade, IBM's EBITDA has shown a fluctuating trend, peaking in 2014 and 2015, with a notable dip in 2022, reflecting a 72% decrease from its 2014 high. Meanwhile, ON Semiconductor has demonstrated a steady upward trajectory, with a remarkable 490% increase in EBITDA from 2014 to 2022, showcasing its robust growth strategy.
This comparative analysis offers valuable insights into the financial strategies and market positioning of these two tech giants.

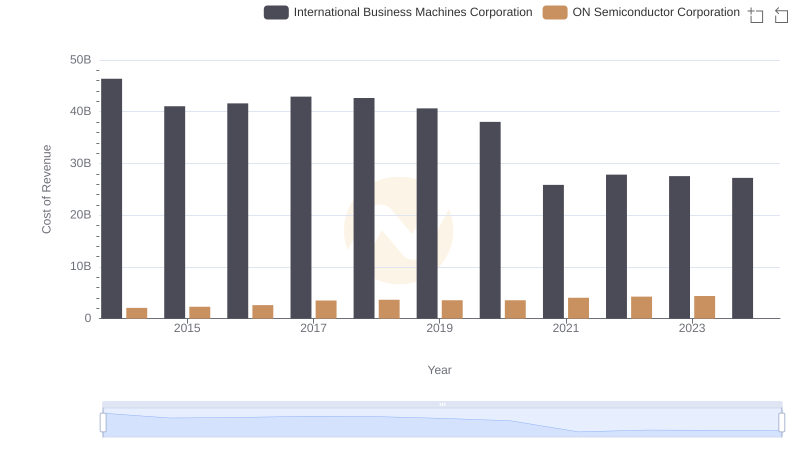
Who Generates More Revenue? International Business Machines Corporation or ON Semiconductor Corporation
Cost Insights: Breaking Down International Business Machines Corporation and ON Semiconductor Corporation's Expenses
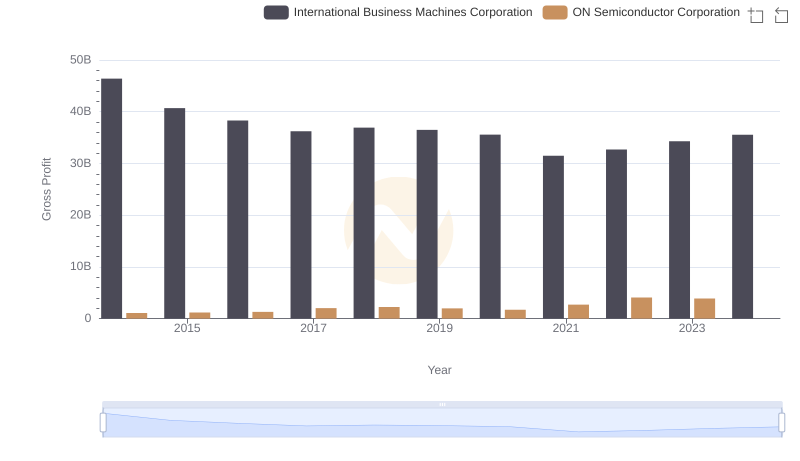
International Business Machines Corporation vs ON Semiconductor Corporation: A Gross Profit Performance Breakdown
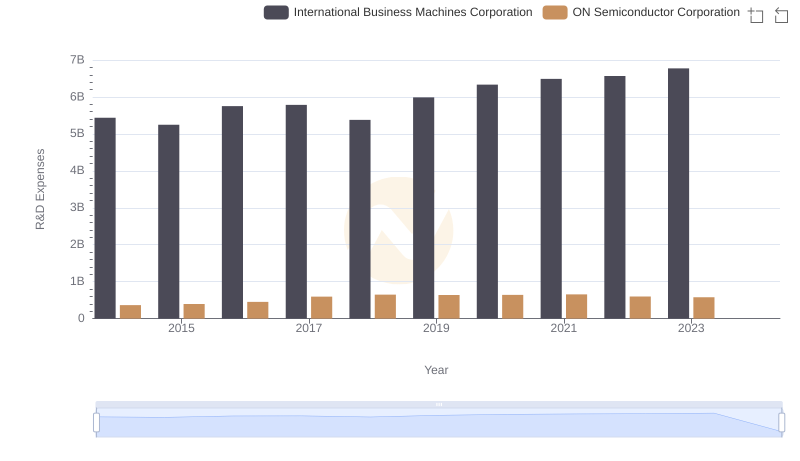
Analyzing R&D Budgets: International Business Machines Corporation vs ON Semiconductor Corporation
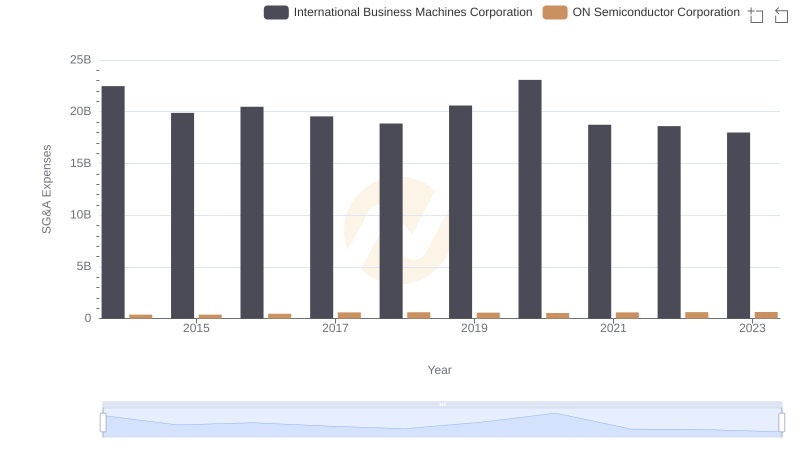
Breaking Down SG&A Expenses: International Business Machines Corporation vs ON Semiconductor Corporation
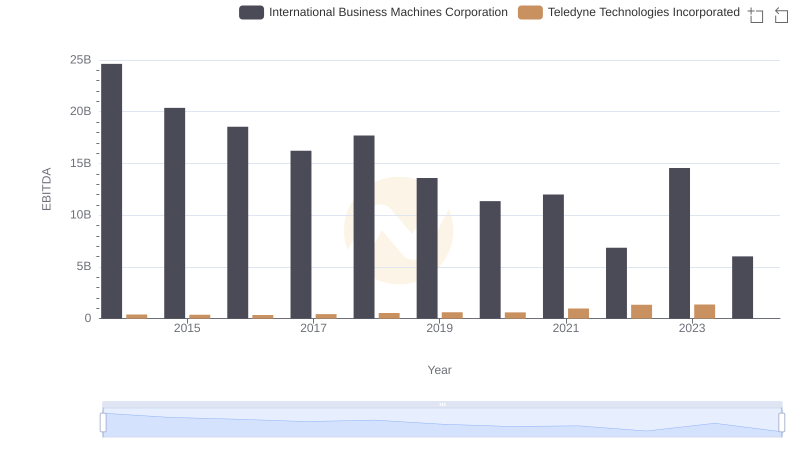
A Professional Review of EBITDA: International Business Machines Corporation Compared to Teledyne Technologies Incorporated

EBITDA Analysis: Evaluating International Business Machines Corporation Against PTC Inc.
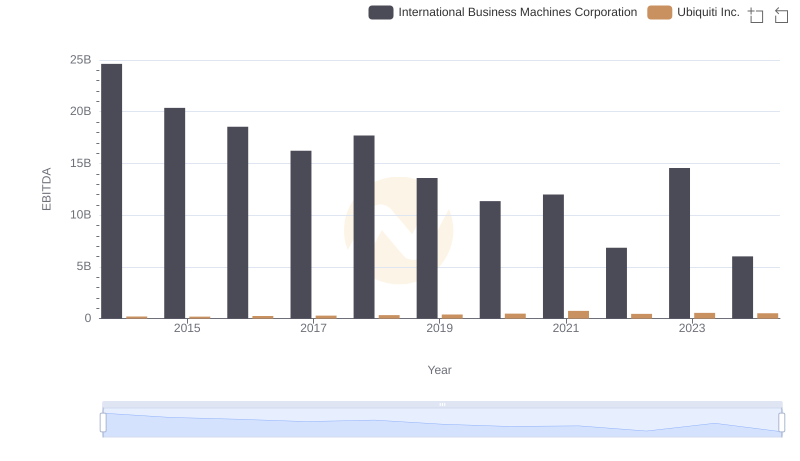
EBITDA Analysis: Evaluating International Business Machines Corporation Against Ubiquiti Inc.
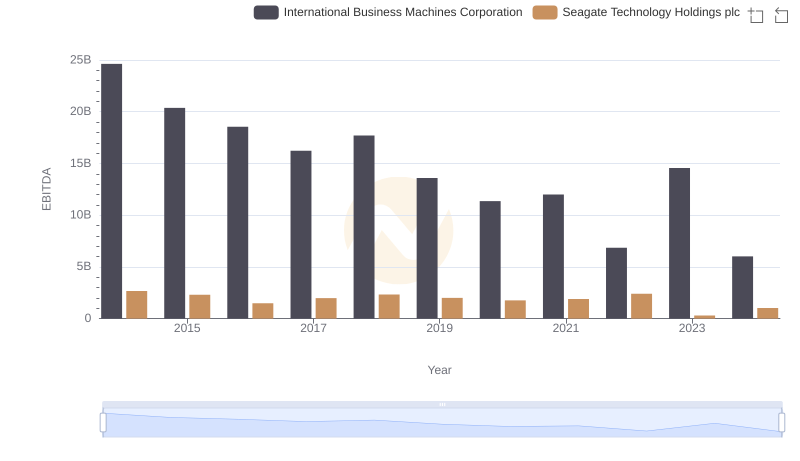
International Business Machines Corporation vs Seagate Technology Holdings plc: In-Depth EBITDA Performance Comparison

International Business Machines Corporation vs FLEETCOR Technologies, Inc.: In-Depth EBITDA Performance Comparison
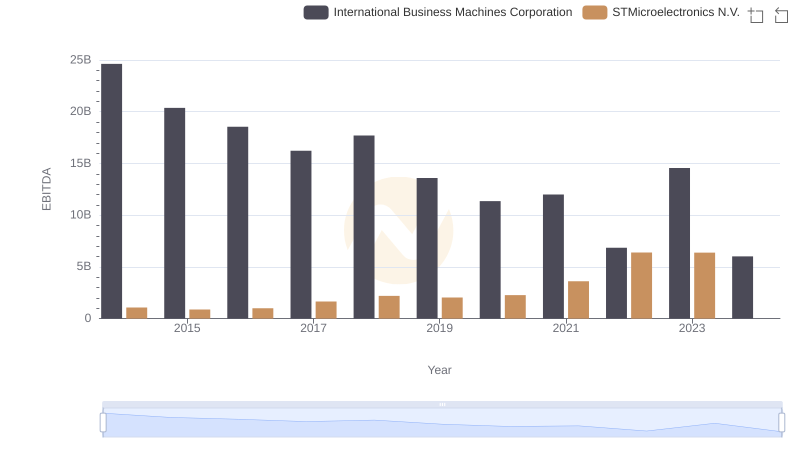
Professional EBITDA Benchmarking: International Business Machines Corporation vs STMicroelectronics N.V.
International Business Machines Corporation and Check Point Software Technologies Ltd.: A Detailed Examination of EBITDA Performance