| __timestamp | Cisco Systems, Inc. | SS&C Technologies Holdings, Inc. |
|---|---|---|
| Wednesday, January 1, 2014 | 12709000000 | 304662000 |
| Thursday, January 1, 2015 | 14209000000 | 291009000 |
| Friday, January 1, 2016 | 15678000000 | 522241000 |
| Sunday, January 1, 2017 | 15383000000 | 628500000 |
| Monday, January 1, 2018 | 16172000000 | 923700000 |
| Tuesday, January 1, 2019 | 17334000000 | 1716500000 |
| Wednesday, January 1, 2020 | 16363000000 | 1751000000 |
| Friday, January 1, 2021 | 15558000000 | 1910100000 |
| Saturday, January 1, 2022 | 16794000000 | 1859800000 |
| Sunday, January 1, 2023 | 17471000000 | 2004400000 |
| Monday, January 1, 2024 | 15747000000 | 1343500000 |
Unlocking the unknown
In the ever-evolving landscape of technology, Cisco Systems, Inc. and SS&C Technologies Holdings, Inc. have carved out significant niches. Over the past decade, Cisco has consistently demonstrated robust EBITDA growth, peaking in 2023 with a 37% increase from 2014. Meanwhile, SS&C Technologies has shown remarkable resilience, with a staggering 556% growth in EBITDA over the same period, despite starting from a much smaller base.
Cisco's EBITDA performance reflects its strategic investments and market dominance, maintaining an average annual growth rate of 3%. This stability underscores its role as a stalwart in the tech industry.
SS&C Technologies, though smaller, has experienced explosive growth, particularly between 2018 and 2023, where its EBITDA nearly doubled. This trajectory highlights its aggressive expansion and adaptability in a competitive market.
Both companies exemplify different paths to success, with Cisco's steady climb and SS&C's rapid ascent offering valuable insights into strategic growth in the tech sector.
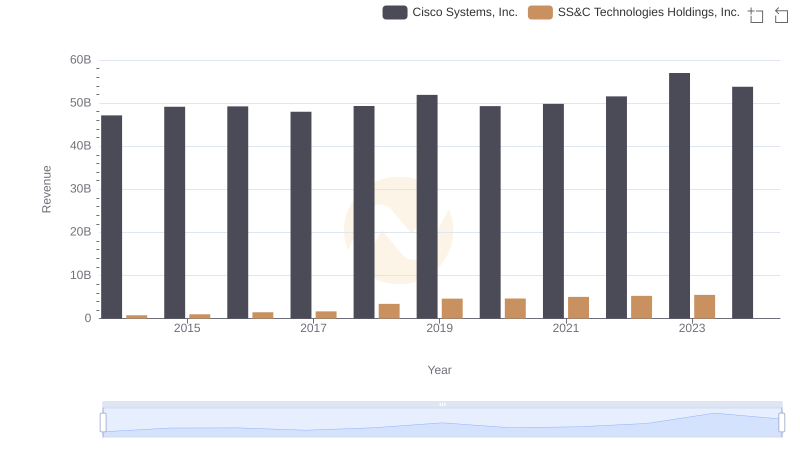
Revenue Showdown: Cisco Systems, Inc. vs SS&C Technologies Holdings, Inc.
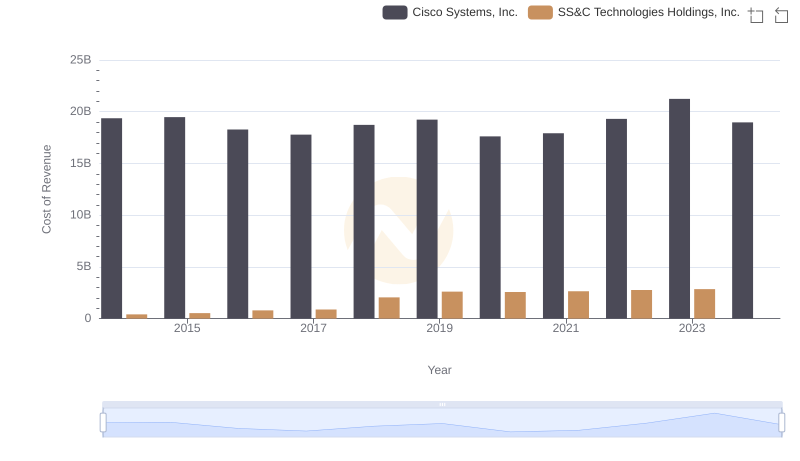
Cisco Systems, Inc. vs SS&C Technologies Holdings, Inc.: Efficiency in Cost of Revenue Explored
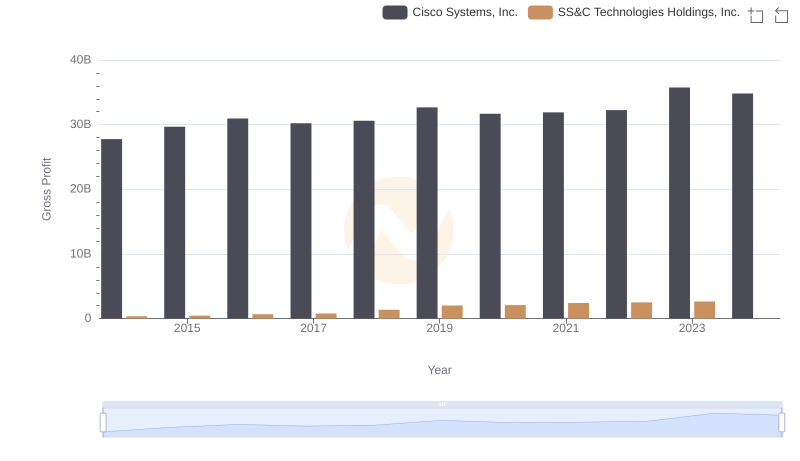
Gross Profit Trends Compared: Cisco Systems, Inc. vs SS&C Technologies Holdings, Inc.
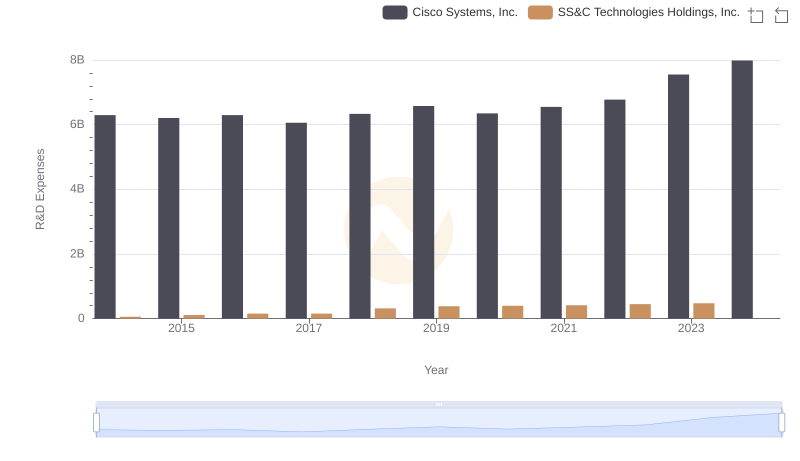
R&D Insights: How Cisco Systems, Inc. and SS&C Technologies Holdings, Inc. Allocate Funds
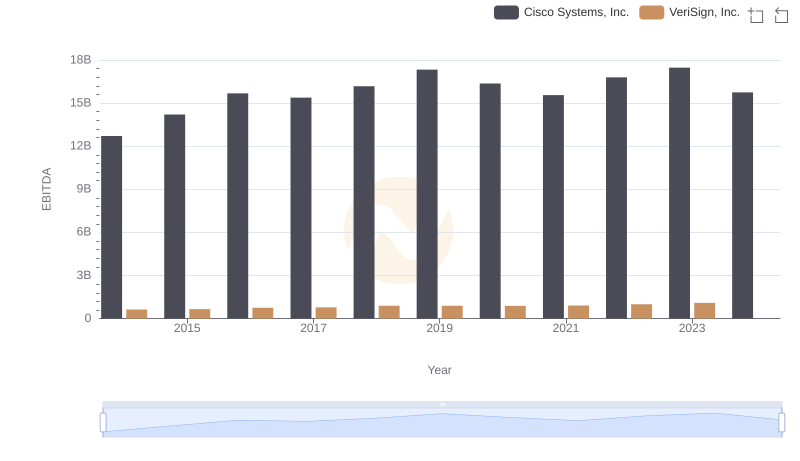
EBITDA Metrics Evaluated: Cisco Systems, Inc. vs VeriSign, Inc.
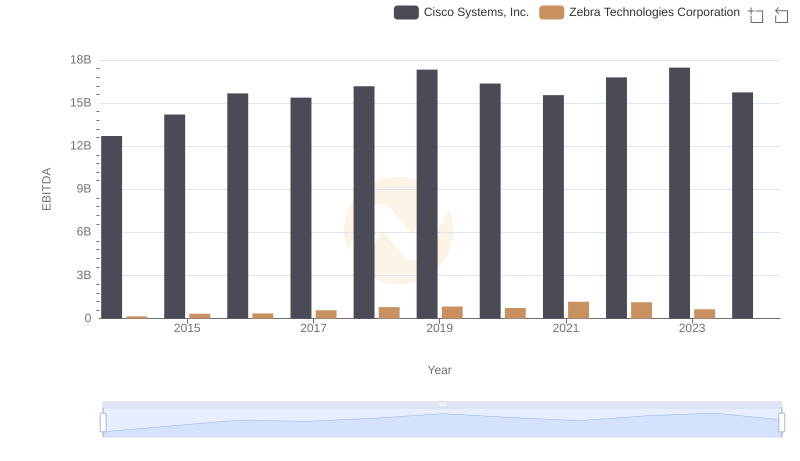
EBITDA Performance Review: Cisco Systems, Inc. vs Zebra Technologies Corporation
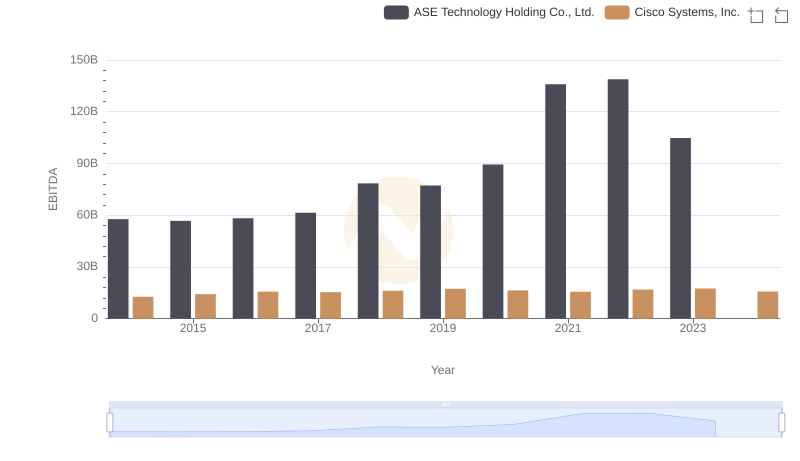
EBITDA Analysis: Evaluating Cisco Systems, Inc. Against ASE Technology Holding Co., Ltd.
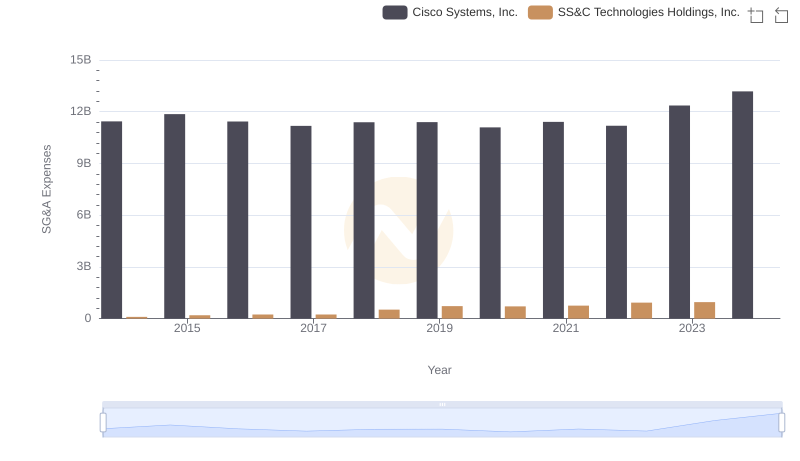
Cisco Systems, Inc. and SS&C Technologies Holdings, Inc.: SG&A Spending Patterns Compared
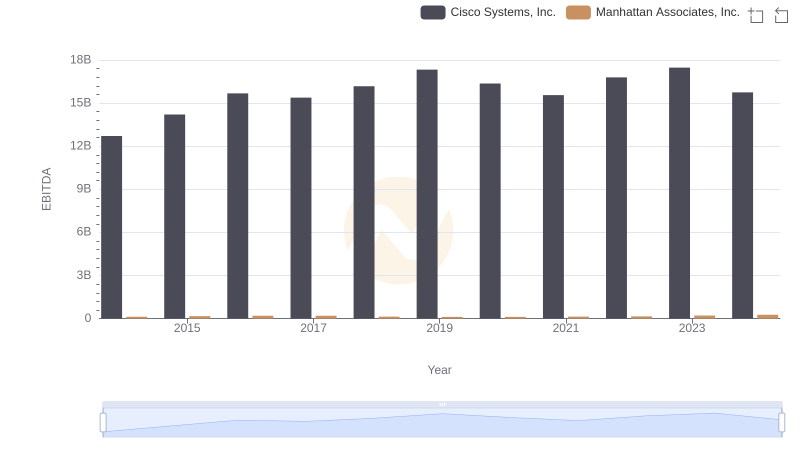
Cisco Systems, Inc. vs Manhattan Associates, Inc.: In-Depth EBITDA Performance Comparison
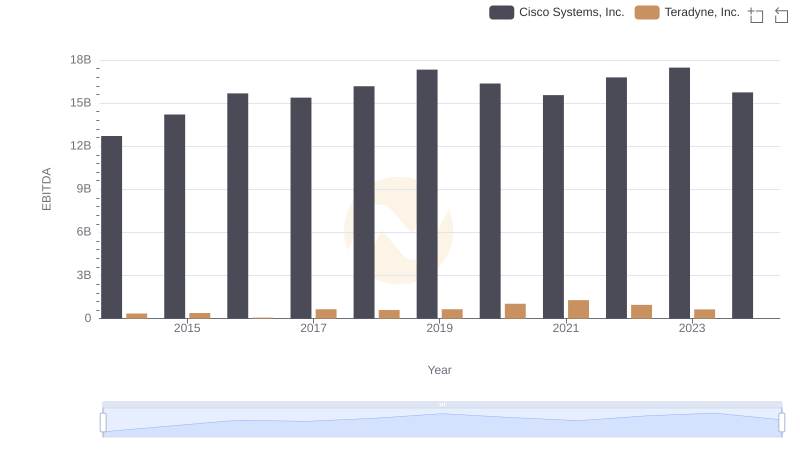
A Side-by-Side Analysis of EBITDA: Cisco Systems, Inc. and Teradyne, Inc.
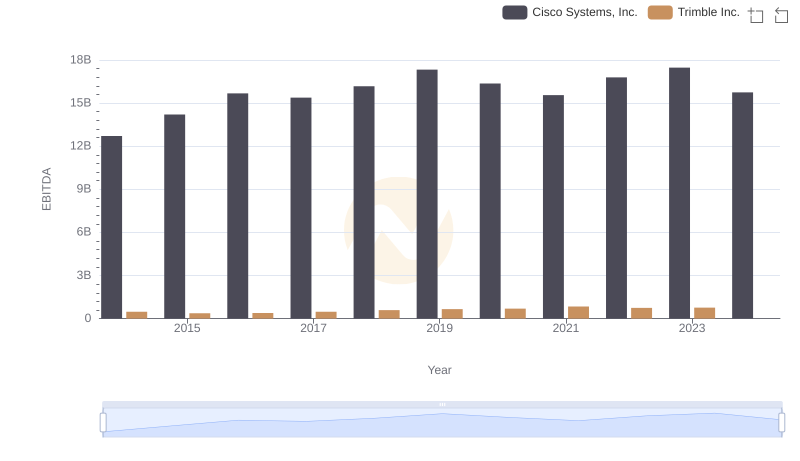
Comparative EBITDA Analysis: Cisco Systems, Inc. vs Trimble Inc.

Professional EBITDA Benchmarking: Cisco Systems, Inc. vs Gen Digital Inc.