| __timestamp | CSX Corporation | Elbit Systems Ltd. |
|---|---|---|
| Wednesday, January 1, 2014 | 3613000000 | 825097000 |
| Thursday, January 1, 2015 | 3584000000 | 897053000 |
| Friday, January 1, 2016 | 3389000000 | 959583000 |
| Sunday, January 1, 2017 | 3773000000 | 997920000 |
| Monday, January 1, 2018 | 4773000000 | 976179000 |
| Tuesday, January 1, 2019 | 4874000000 | 1136467000 |
| Wednesday, January 1, 2020 | 4362000000 | 1165107000 |
| Friday, January 1, 2021 | 5140000000 | 1358048000 |
| Saturday, January 1, 2022 | 5785000000 | 1373283000 |
| Sunday, January 1, 2023 | 5527000000 | 1482954000 |
Unleashing the power of data
In the ever-evolving landscape of global business, understanding the financial health of companies is crucial. This analysis compares the gross profit trends of two industry giants: CSX Corporation, a leader in rail transportation, and Elbit Systems Ltd., a prominent player in defense electronics.
From 2014 to 2023, CSX Corporation has demonstrated a robust growth trajectory, with its gross profit increasing by approximately 53%. This growth reflects the company's strategic initiatives and operational efficiencies. In contrast, Elbit Systems Ltd. has seen a steady rise of about 80% in the same period, showcasing its resilience and adaptability in the defense sector.
While CSX Corporation's gross profit peaked in 2022, Elbit Systems Ltd. continued its upward trend into 2023. This divergence highlights the distinct market dynamics and strategic priorities of each company. As we look to the future, these trends offer valuable insights into the competitive landscape of their respective industries.
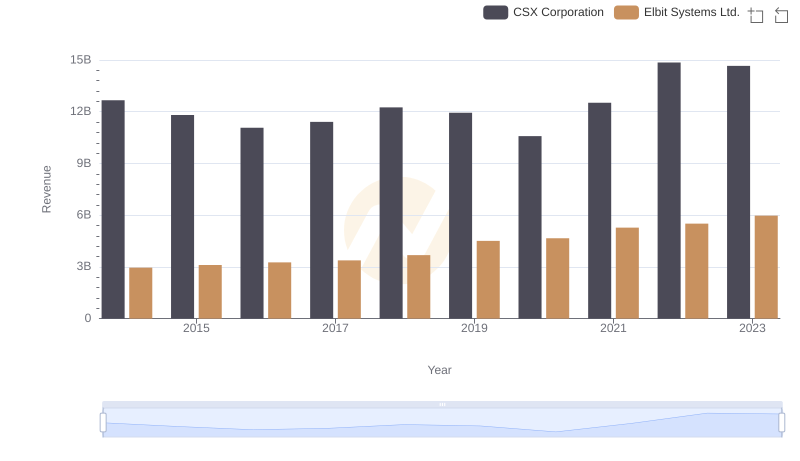
CSX Corporation vs Elbit Systems Ltd.: Annual Revenue Growth Compared
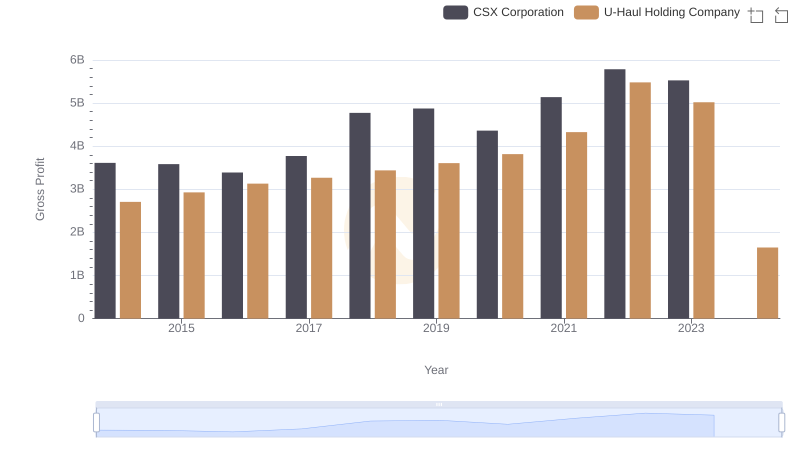
CSX Corporation vs U-Haul Holding Company: A Gross Profit Performance Breakdown
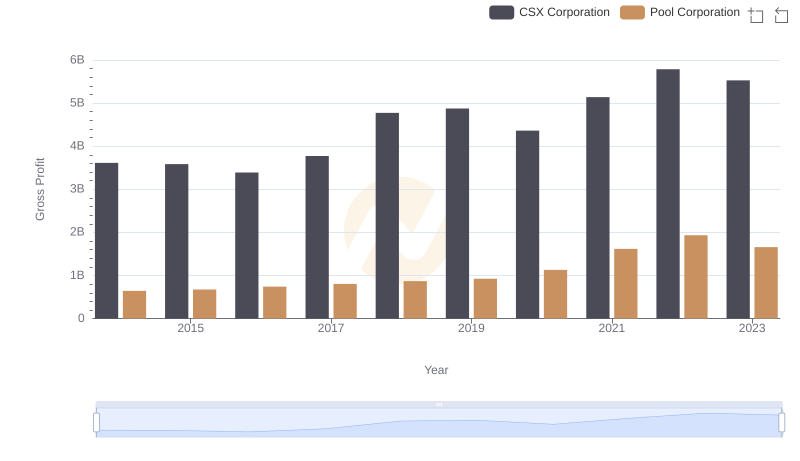
CSX Corporation vs Pool Corporation: A Gross Profit Performance Breakdown
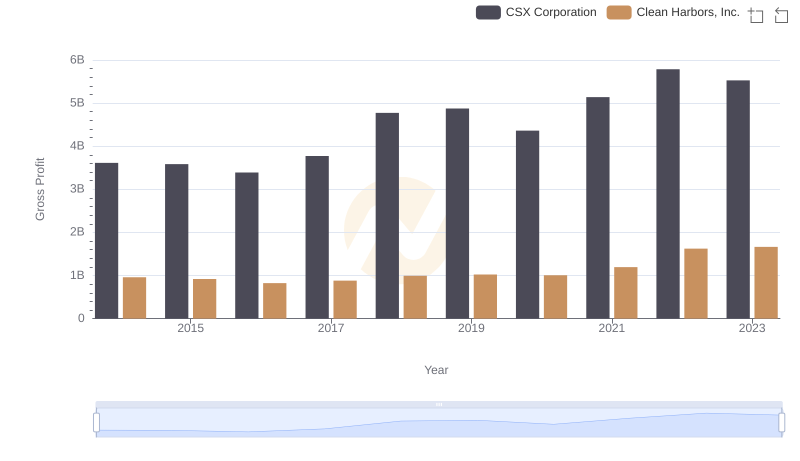
Gross Profit Analysis: Comparing CSX Corporation and Clean Harbors, Inc.
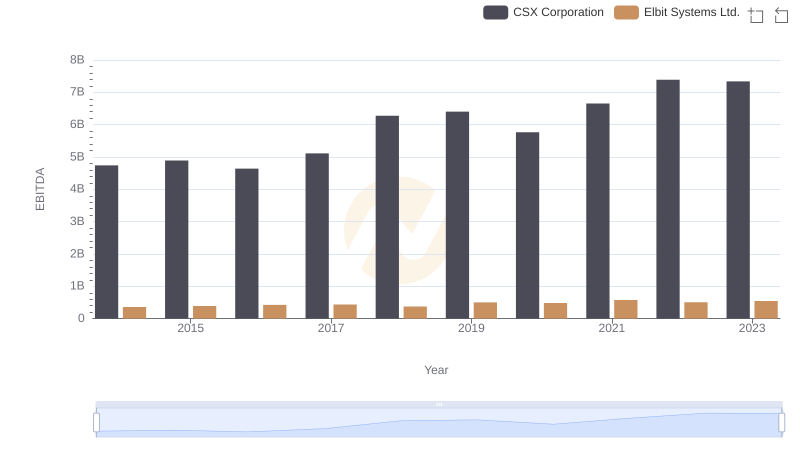
CSX Corporation vs Elbit Systems Ltd.: In-Depth EBITDA Performance Comparison