| __timestamp | Snap-on Incorporated | Westinghouse Air Brake Technologies Corporation |
|---|---|---|
| Wednesday, January 1, 2014 | 1693400000 | 2130920000 |
| Thursday, January 1, 2015 | 1704500000 | 2281845000 |
| Friday, January 1, 2016 | 1720800000 | 2029647000 |
| Sunday, January 1, 2017 | 1862000000 | 2841159000 |
| Monday, January 1, 2018 | 1870700000 | 3151816000 |
| Tuesday, January 1, 2019 | 1886000000 | 6122400000 |
| Wednesday, January 1, 2020 | 1844000000 | 5657400000 |
| Friday, January 1, 2021 | 2141200000 | 5687000000 |
| Saturday, January 1, 2022 | 2311700000 | 6070000000 |
| Sunday, January 1, 2023 | 2488500000 | 6733000000 |
| Monday, January 1, 2024 | 2329500000 | 7021000000 |
Unlocking the unknown
In the ever-evolving landscape of industrial and manufacturing sectors, understanding cost dynamics is crucial. This analysis delves into the cost of revenue trends for two industry giants: Westinghouse Air Brake Technologies Corporation and Snap-on Incorporated, from 2014 to 2023.
Over the past decade, Westinghouse Air Brake Technologies Corporation has seen a significant increase in its cost of revenue, growing by approximately 216% from 2014 to 2023. This upward trend reflects the company's expansion and increased operational scale, peaking in 2023.
Snap-on Incorporated, on the other hand, experienced a more modest growth of around 47% in the same period. This steady rise indicates a consistent operational strategy, with a notable increase in 2023.
These trends highlight the contrasting growth strategies and market responses of these two corporations, offering valuable insights for investors and industry analysts.
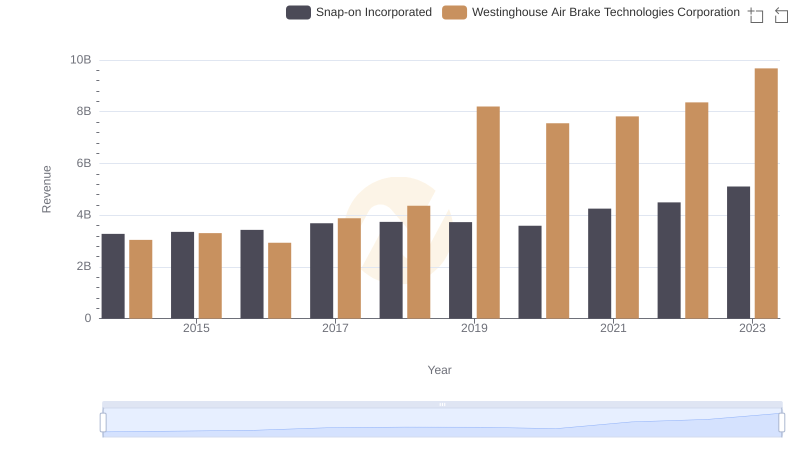
Revenue Insights: Westinghouse Air Brake Technologies Corporation and Snap-on Incorporated Performance Compared
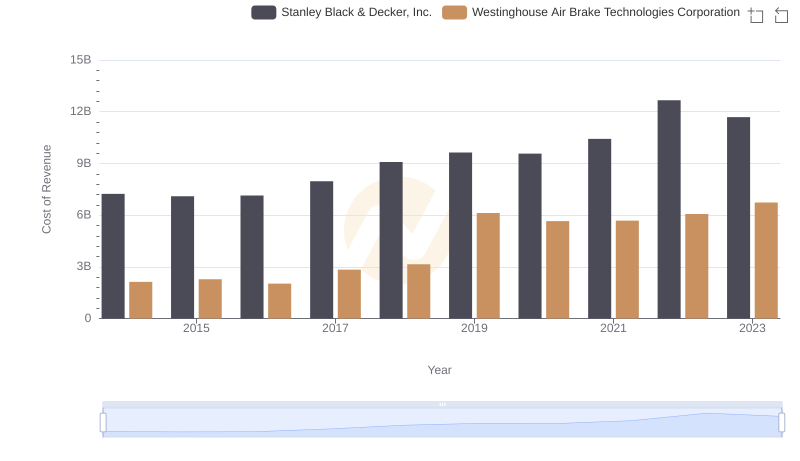
Cost of Revenue Trends: Westinghouse Air Brake Technologies Corporation vs Stanley Black & Decker, Inc.
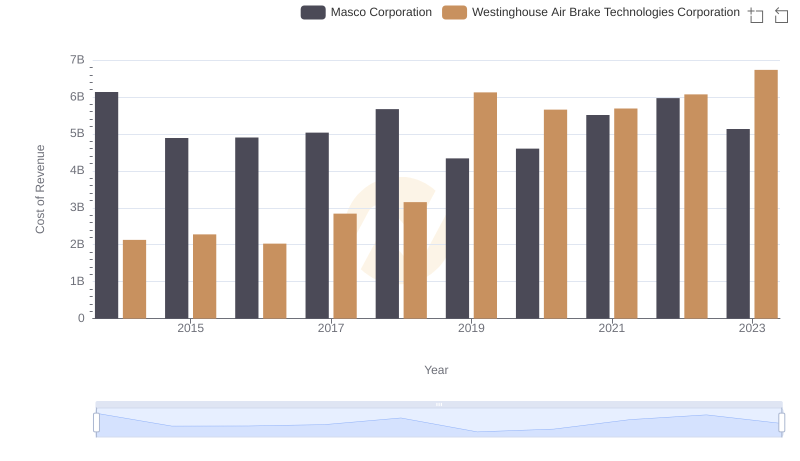
Cost Insights: Breaking Down Westinghouse Air Brake Technologies Corporation and Masco Corporation's Expenses
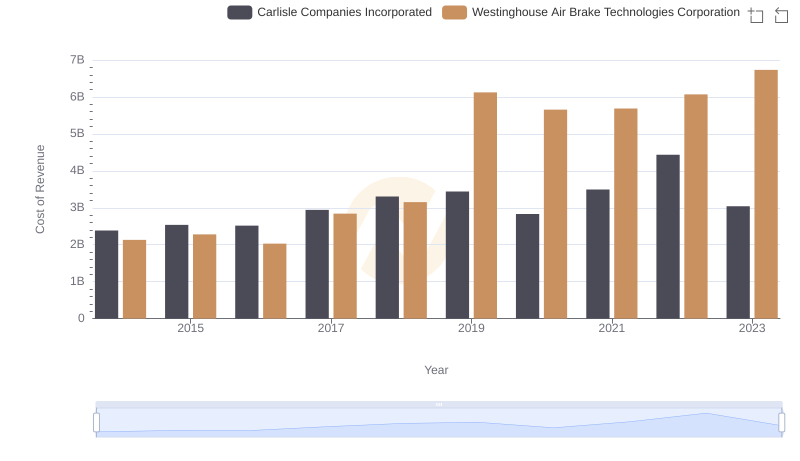
Cost of Revenue Trends: Westinghouse Air Brake Technologies Corporation vs Carlisle Companies Incorporated
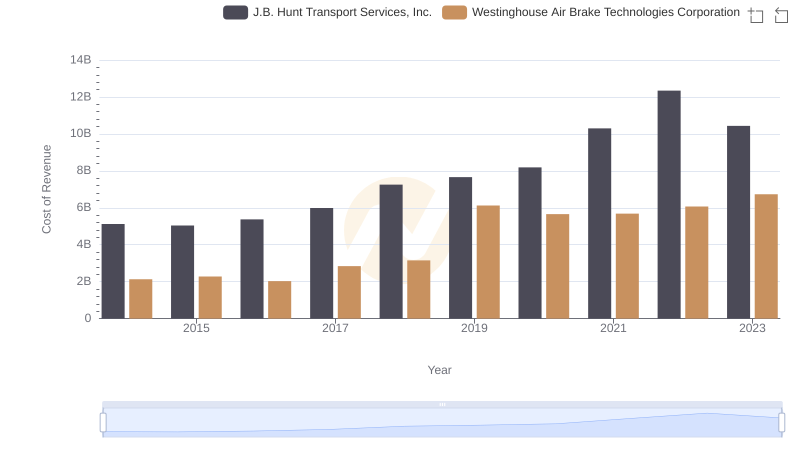
Comparing Cost of Revenue Efficiency: Westinghouse Air Brake Technologies Corporation vs J.B. Hunt Transport Services, Inc.
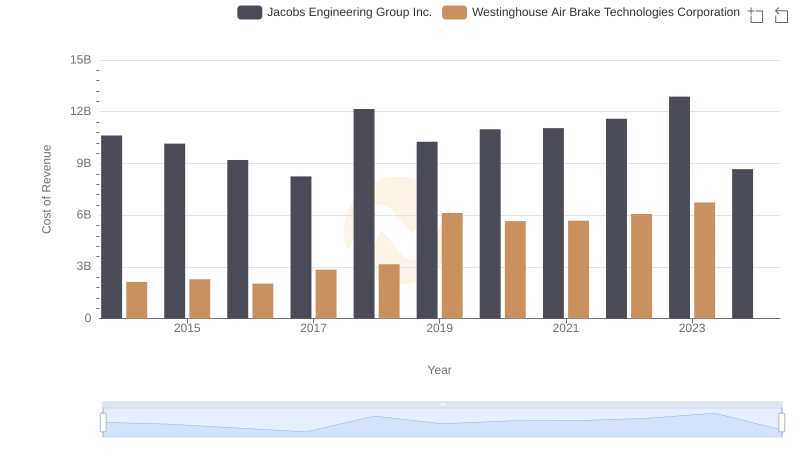
Cost Insights: Breaking Down Westinghouse Air Brake Technologies Corporation and Jacobs Engineering Group Inc.'s Expenses
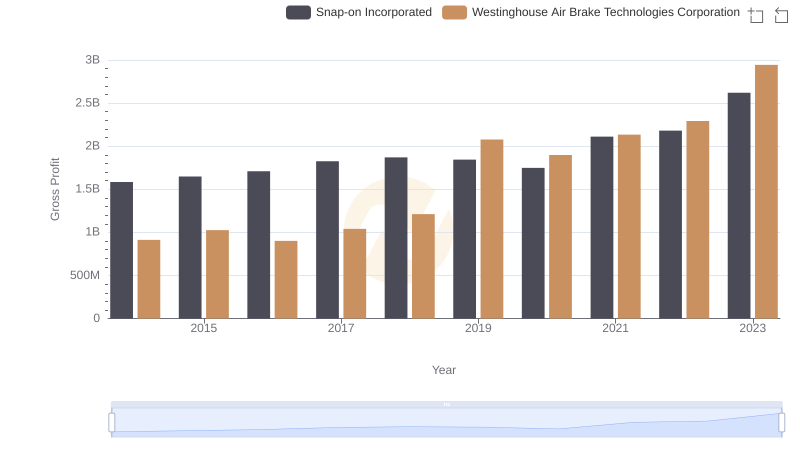
Gross Profit Analysis: Comparing Westinghouse Air Brake Technologies Corporation and Snap-on Incorporated
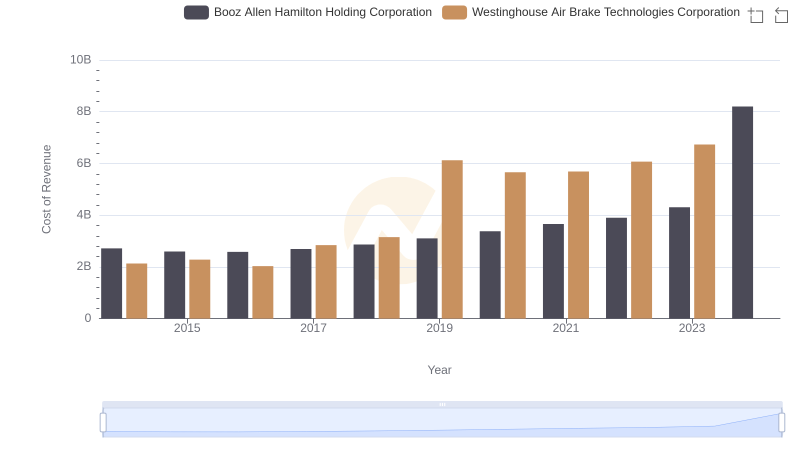
Westinghouse Air Brake Technologies Corporation vs Booz Allen Hamilton Holding Corporation: Efficiency in Cost of Revenue Explored
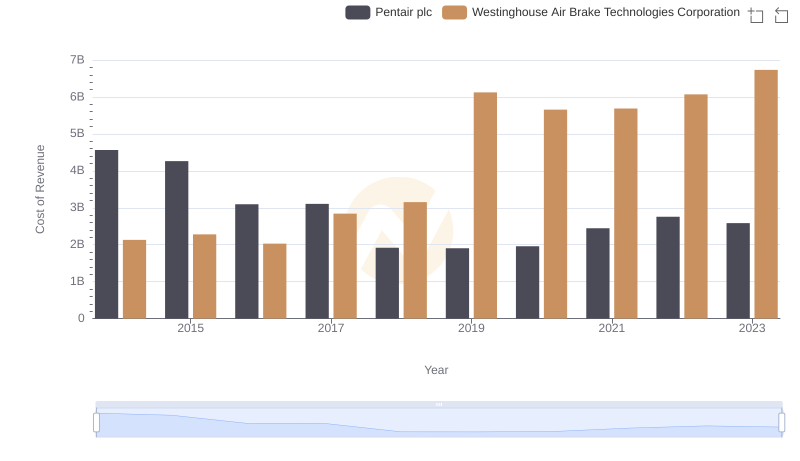
Analyzing Cost of Revenue: Westinghouse Air Brake Technologies Corporation and Pentair plc
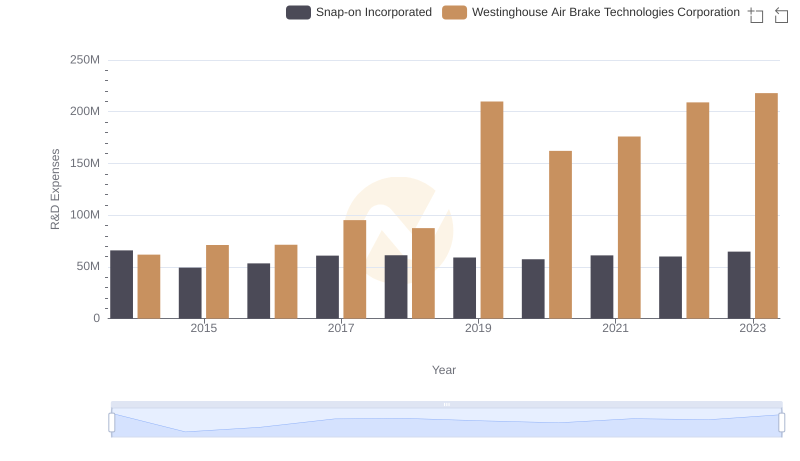
R&D Insights: How Westinghouse Air Brake Technologies Corporation and Snap-on Incorporated Allocate Funds

SG&A Efficiency Analysis: Comparing Westinghouse Air Brake Technologies Corporation and Snap-on Incorporated
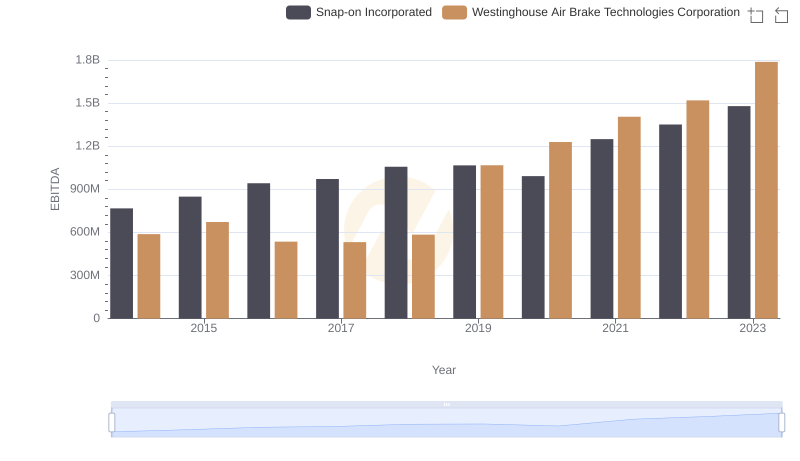
EBITDA Analysis: Evaluating Westinghouse Air Brake Technologies Corporation Against Snap-on Incorporated