| __timestamp | Carlisle Companies Incorporated | Westinghouse Air Brake Technologies Corporation |
|---|---|---|
| Wednesday, January 1, 2014 | 2384500000 | 2130920000 |
| Thursday, January 1, 2015 | 2536500000 | 2281845000 |
| Friday, January 1, 2016 | 2518100000 | 2029647000 |
| Sunday, January 1, 2017 | 2941900000 | 2841159000 |
| Monday, January 1, 2018 | 3304800000 | 3151816000 |
| Tuesday, January 1, 2019 | 3439900000 | 6122400000 |
| Wednesday, January 1, 2020 | 2832500000 | 5657400000 |
| Friday, January 1, 2021 | 3495600000 | 5687000000 |
| Saturday, January 1, 2022 | 4434500000 | 6070000000 |
| Sunday, January 1, 2023 | 3042900000 | 6733000000 |
| Monday, January 1, 2024 | 3115900000 | 7021000000 |
Igniting the spark of knowledge
In the competitive landscape of industrial manufacturing, Westinghouse Air Brake Technologies Corporation and Carlisle Companies Incorporated have showcased intriguing cost of revenue trends over the past decade. From 2014 to 2023, Westinghouse Air Brake Technologies Corporation experienced a significant increase in its cost of revenue, peaking at approximately 6.7 billion in 2023, marking a 216% rise from its 2014 figures. Meanwhile, Carlisle Companies Incorporated saw a more modest growth, with its cost of revenue increasing by about 28% over the same period, reaching a high of 4.4 billion in 2022. This divergence highlights the differing strategies and market conditions faced by these two industry leaders. As Westinghouse continues to expand its operations, Carlisle's steady growth reflects its focus on efficiency and cost management. These trends offer valuable insights into the evolving dynamics of the industrial sector.
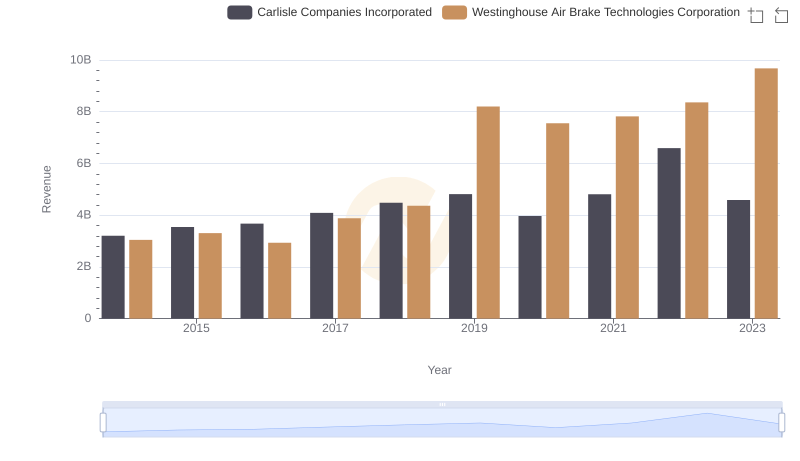
Comparing Revenue Performance: Westinghouse Air Brake Technologies Corporation or Carlisle Companies Incorporated?
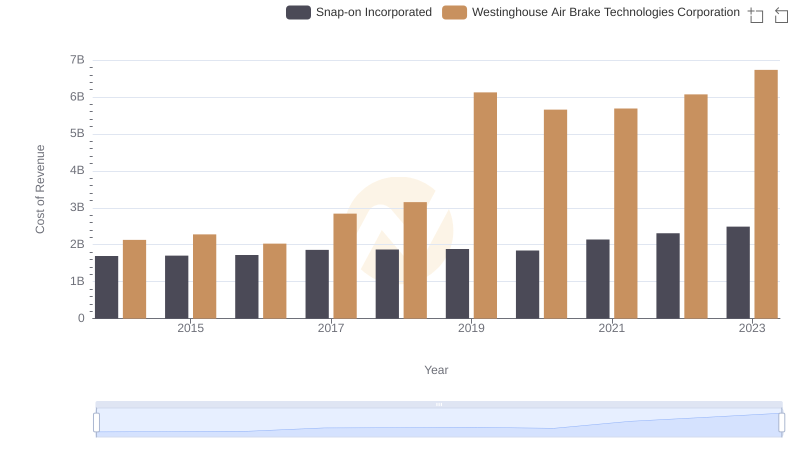
Cost of Revenue Trends: Westinghouse Air Brake Technologies Corporation vs Snap-on Incorporated
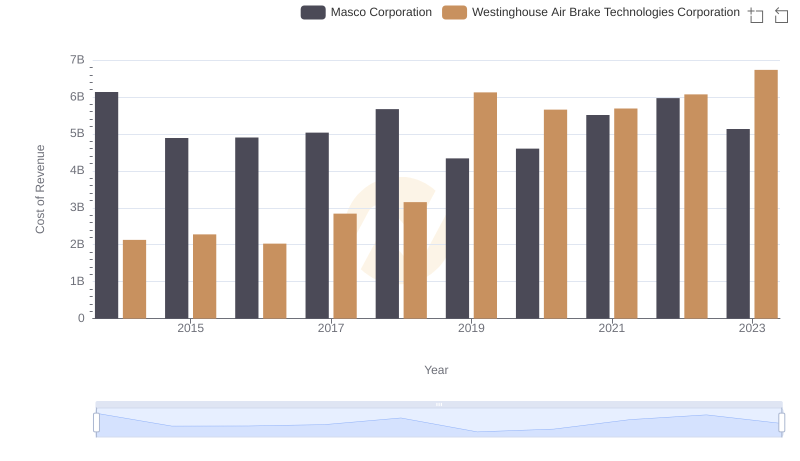
Cost Insights: Breaking Down Westinghouse Air Brake Technologies Corporation and Masco Corporation's Expenses
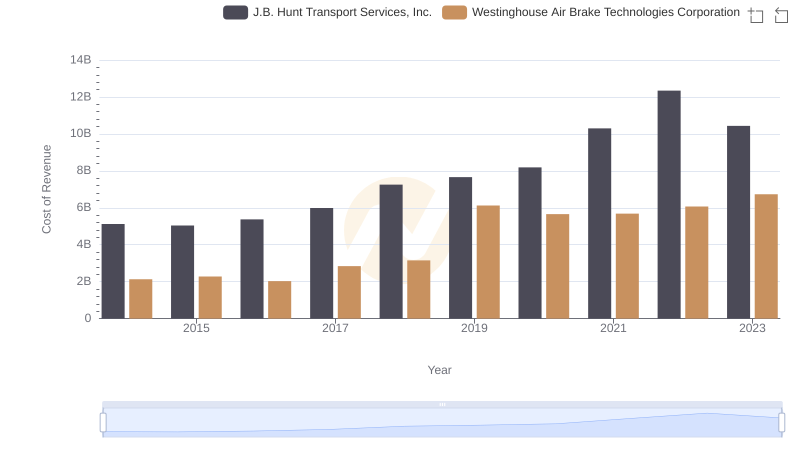
Comparing Cost of Revenue Efficiency: Westinghouse Air Brake Technologies Corporation vs J.B. Hunt Transport Services, Inc.
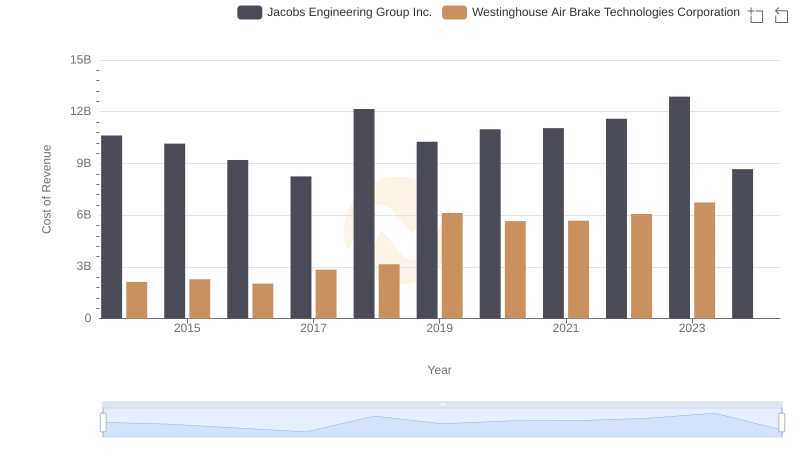
Cost Insights: Breaking Down Westinghouse Air Brake Technologies Corporation and Jacobs Engineering Group Inc.'s Expenses
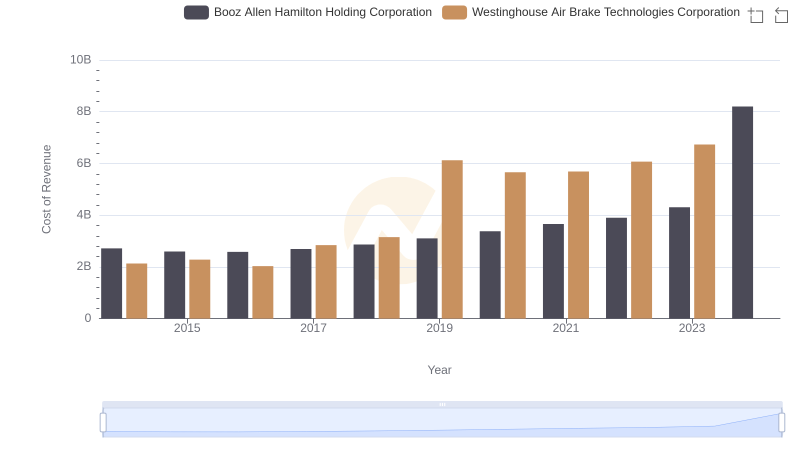
Westinghouse Air Brake Technologies Corporation vs Booz Allen Hamilton Holding Corporation: Efficiency in Cost of Revenue Explored
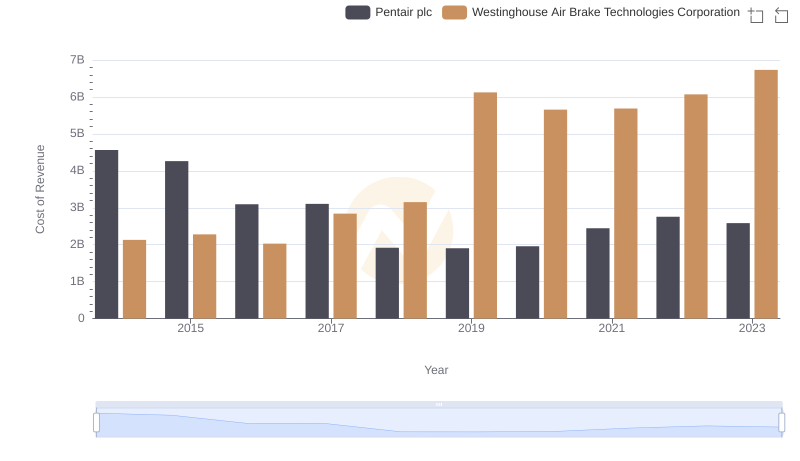
Analyzing Cost of Revenue: Westinghouse Air Brake Technologies Corporation and Pentair plc
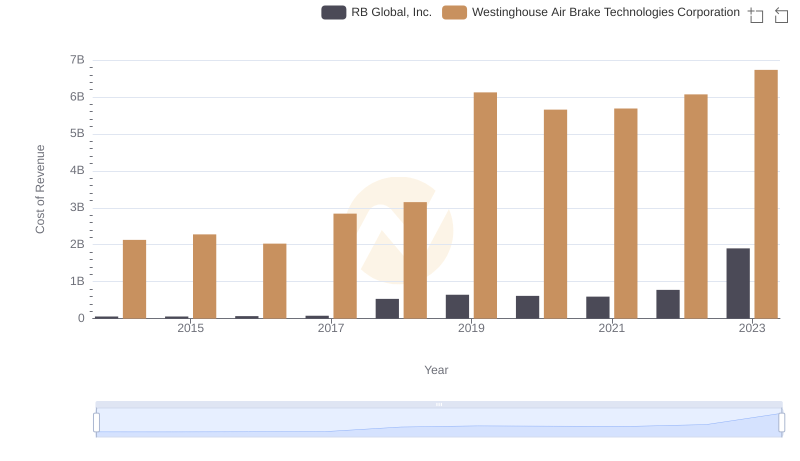
Comparing Cost of Revenue Efficiency: Westinghouse Air Brake Technologies Corporation vs RB Global, Inc.
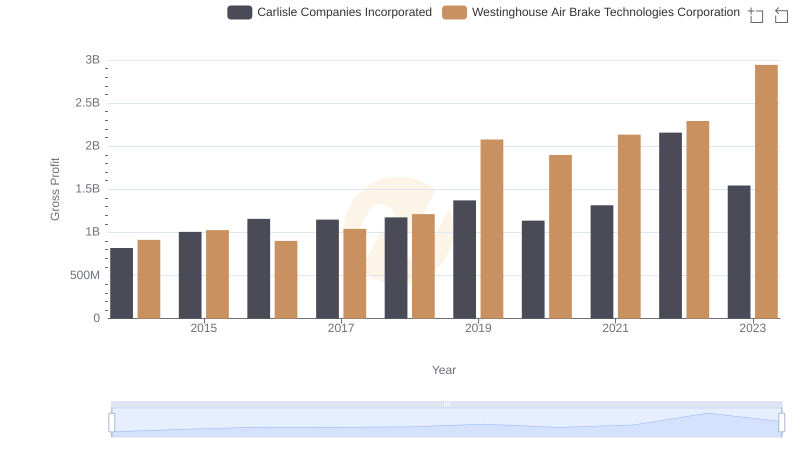
Westinghouse Air Brake Technologies Corporation and Carlisle Companies Incorporated: A Detailed Gross Profit Analysis
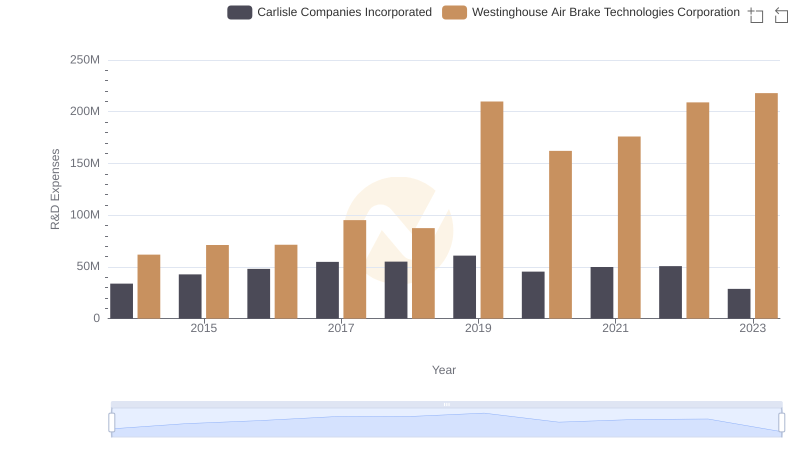
Research and Development Investment: Westinghouse Air Brake Technologies Corporation vs Carlisle Companies Incorporated
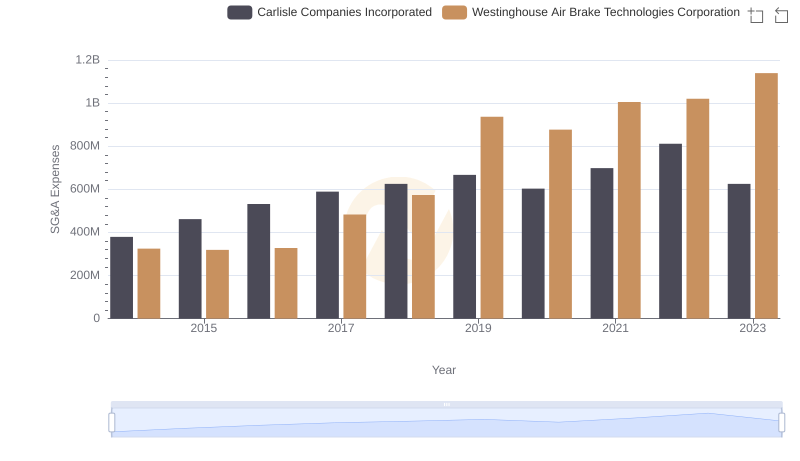
SG&A Efficiency Analysis: Comparing Westinghouse Air Brake Technologies Corporation and Carlisle Companies Incorporated
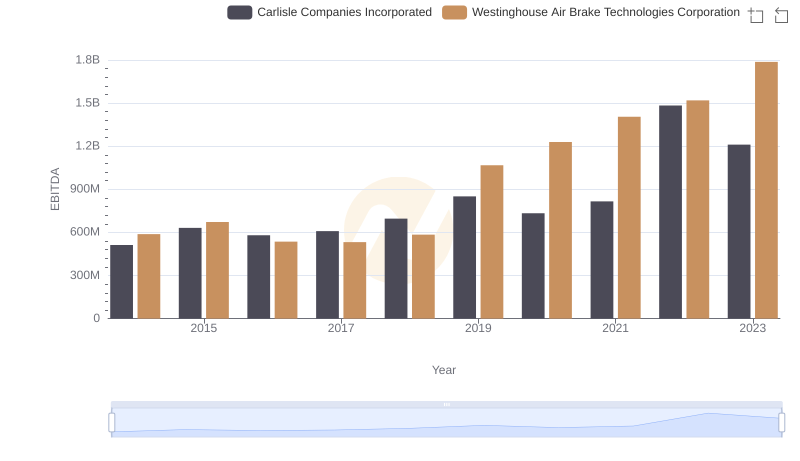
A Side-by-Side Analysis of EBITDA: Westinghouse Air Brake Technologies Corporation and Carlisle Companies Incorporated