| __timestamp | Stanley Black & Decker, Inc. | Westinghouse Air Brake Technologies Corporation |
|---|---|---|
| Wednesday, January 1, 2014 | 7235900000 | 2130920000 |
| Thursday, January 1, 2015 | 7099800000 | 2281845000 |
| Friday, January 1, 2016 | 7139700000 | 2029647000 |
| Sunday, January 1, 2017 | 7969200000 | 2841159000 |
| Monday, January 1, 2018 | 9080500000 | 3151816000 |
| Tuesday, January 1, 2019 | 9636700000 | 6122400000 |
| Wednesday, January 1, 2020 | 9566700000 | 5657400000 |
| Friday, January 1, 2021 | 10423000000 | 5687000000 |
| Saturday, January 1, 2022 | 12663300000 | 6070000000 |
| Sunday, January 1, 2023 | 11683100000 | 6733000000 |
| Monday, January 1, 2024 | 10851300000 | 7021000000 |
Unleashing insights
In the ever-evolving landscape of industrial manufacturing, understanding cost dynamics is crucial. Westinghouse Air Brake Technologies Corporation and Stanley Black & Decker, Inc. have been pivotal players in this arena. From 2014 to 2023, Stanley Black & Decker's cost of revenue surged by approximately 61%, peaking in 2022. This reflects their aggressive expansion and market adaptation strategies. Meanwhile, Westinghouse Air Brake Technologies saw a 216% increase, highlighting their robust growth trajectory, especially post-2018. Notably, 2019 marked a significant leap for Westinghouse, with a 94% rise compared to the previous year, underscoring strategic acquisitions and operational efficiencies. These trends not only reveal the companies' financial health but also provide insights into broader industry shifts. As we navigate through 2023, these insights are invaluable for stakeholders aiming to forecast future market movements.
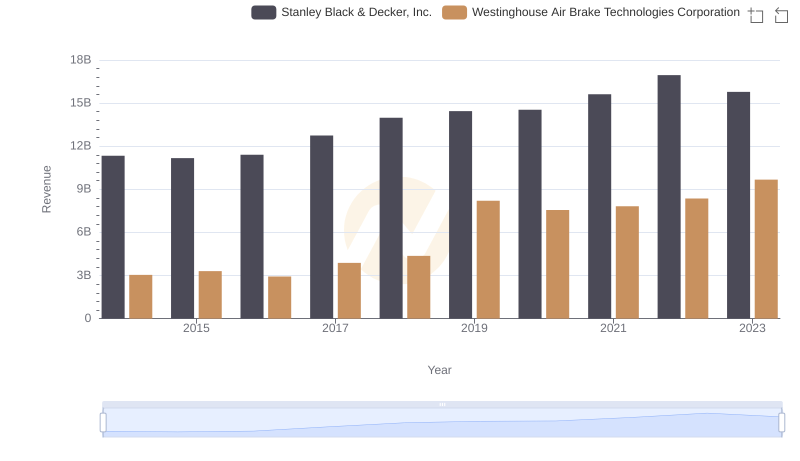
Westinghouse Air Brake Technologies Corporation vs Stanley Black & Decker, Inc.: Examining Key Revenue Metrics

Cost Insights: Breaking Down Westinghouse Air Brake Technologies Corporation and TransUnion's Expenses
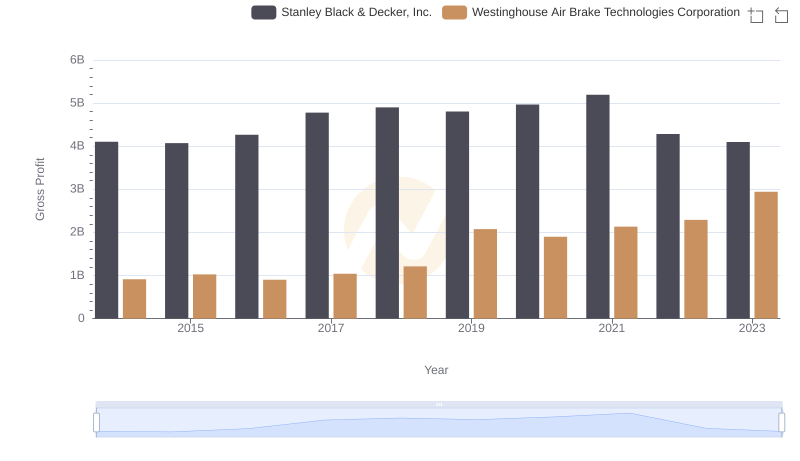
Who Generates Higher Gross Profit? Westinghouse Air Brake Technologies Corporation or Stanley Black & Decker, Inc.

Comparing Innovation Spending: Westinghouse Air Brake Technologies Corporation and Stanley Black & Decker, Inc.
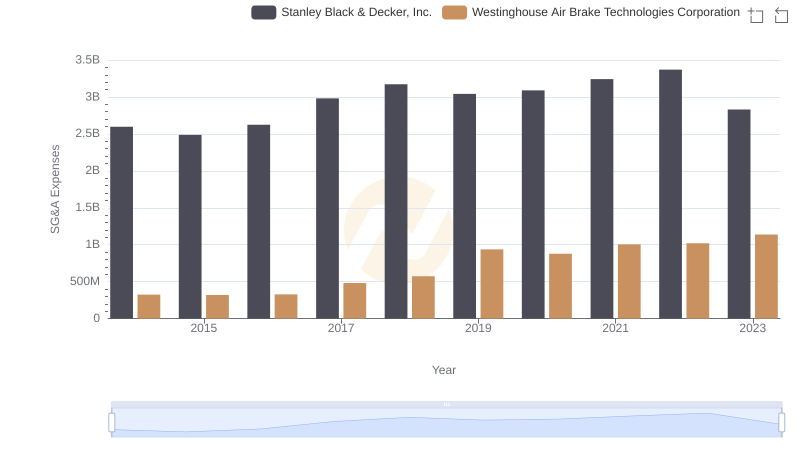
Who Optimizes SG&A Costs Better? Westinghouse Air Brake Technologies Corporation or Stanley Black & Decker, Inc.
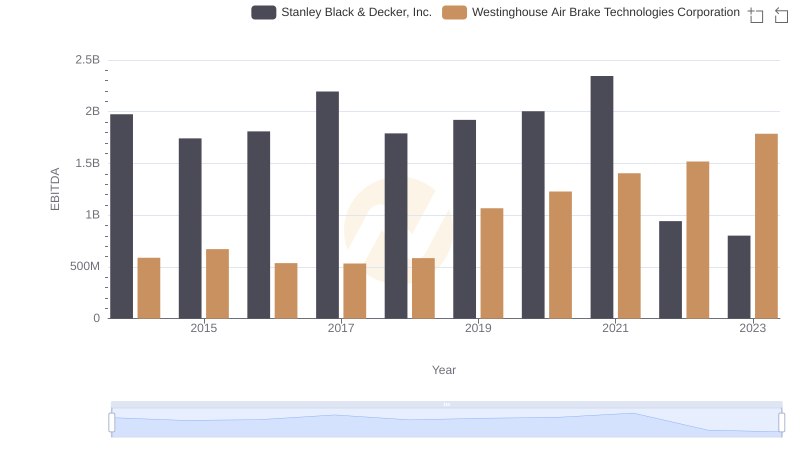
Comparative EBITDA Analysis: Westinghouse Air Brake Technologies Corporation vs Stanley Black & Decker, Inc.

Breaking Down Revenue Trends: Westinghouse Air Brake Technologies Corporation vs Stanley Black & Decker, Inc.
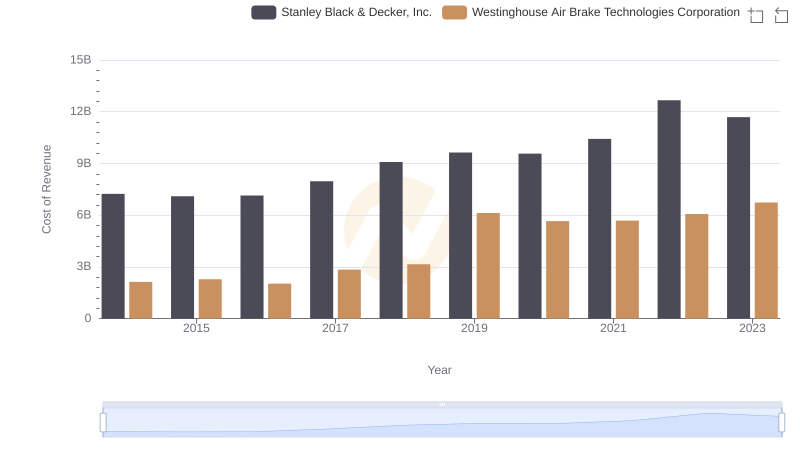
Cost of Revenue Comparison: Westinghouse Air Brake Technologies Corporation vs Stanley Black & Decker, Inc.

Who Generates Higher Gross Profit? Westinghouse Air Brake Technologies Corporation or Stanley Black & Decker, Inc.
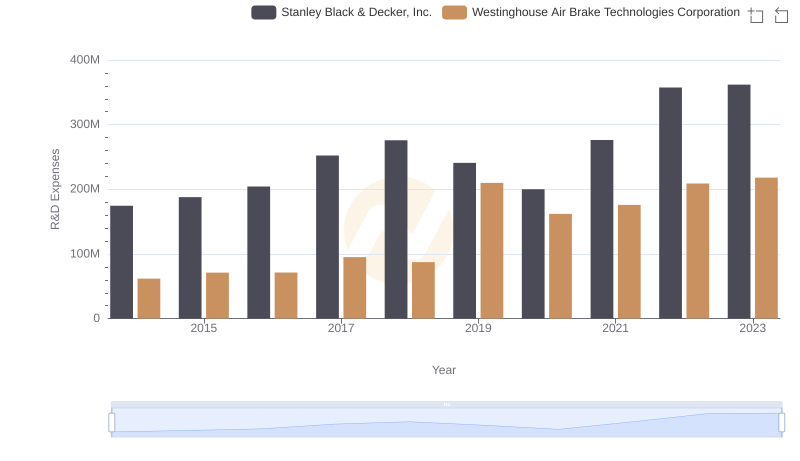
Westinghouse Air Brake Technologies Corporation vs Stanley Black & Decker, Inc.: Strategic Focus on R&D Spending

Selling, General, and Administrative Costs: Westinghouse Air Brake Technologies Corporation vs Stanley Black & Decker, Inc.

Westinghouse Air Brake Technologies Corporation and Stanley Black & Decker, Inc.: A Detailed Examination of EBITDA Performance