| __timestamp | Jacobs Engineering Group Inc. | Westinghouse Air Brake Technologies Corporation |
|---|---|---|
| Wednesday, January 1, 2014 | 10621373000 | 2130920000 |
| Thursday, January 1, 2015 | 10146494000 | 2281845000 |
| Friday, January 1, 2016 | 9196326000 | 2029647000 |
| Sunday, January 1, 2017 | 8250536000 | 2841159000 |
| Monday, January 1, 2018 | 12156276000 | 3151816000 |
| Tuesday, January 1, 2019 | 10260840000 | 6122400000 |
| Wednesday, January 1, 2020 | 10980307000 | 5657400000 |
| Friday, January 1, 2021 | 11048860000 | 5687000000 |
| Saturday, January 1, 2022 | 11595785000 | 6070000000 |
| Sunday, January 1, 2023 | 12879099000 | 6733000000 |
| Monday, January 1, 2024 | 8668185000 | 7021000000 |
Unleashing insights
In the ever-evolving landscape of industrial engineering, understanding cost structures is pivotal. Westinghouse Air Brake Technologies Corporation and Jacobs Engineering Group Inc. have been at the forefront of this sector, showcasing distinct financial trajectories over the past decade. From 2014 to 2023, Jacobs Engineering Group Inc. consistently maintained a higher cost of revenue, peaking in 2023 with a 21% increase from 2014. In contrast, Westinghouse Air Brake Technologies Corporation exhibited a more volatile pattern, with a notable 216% rise in costs from 2014 to 2023. This disparity highlights differing operational strategies and market responses. Notably, data for 2024 is incomplete, suggesting potential shifts in the coming years. As these companies navigate the complexities of global markets, their cost management strategies will be crucial in maintaining competitive edges.
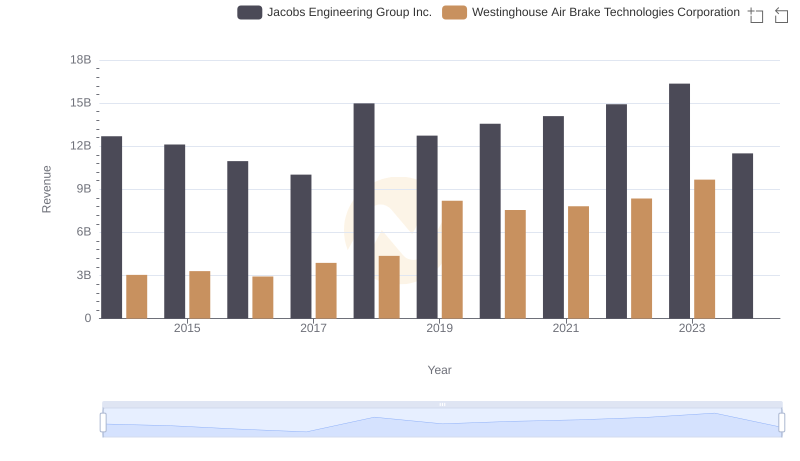
Who Generates More Revenue? Westinghouse Air Brake Technologies Corporation or Jacobs Engineering Group Inc.
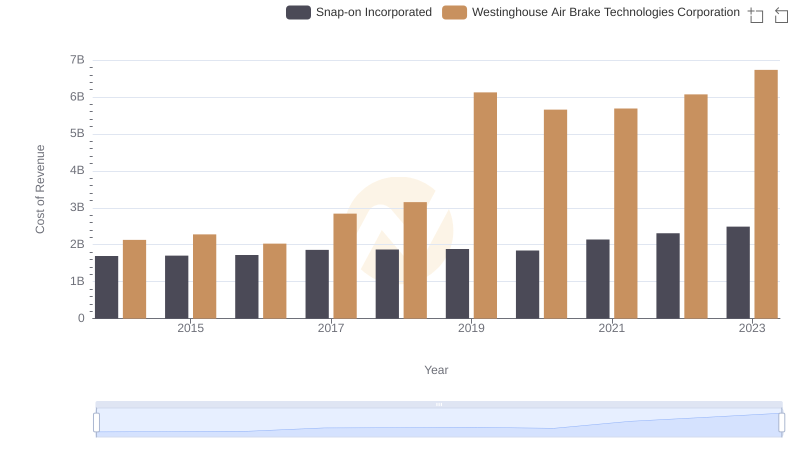
Cost of Revenue Trends: Westinghouse Air Brake Technologies Corporation vs Snap-on Incorporated
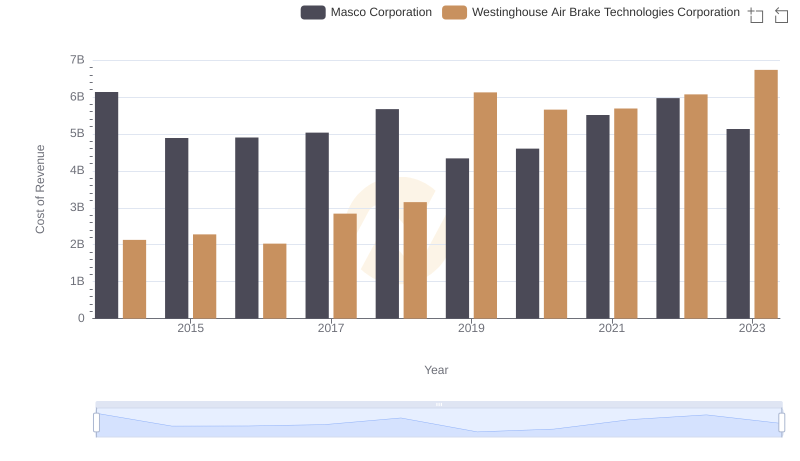
Cost Insights: Breaking Down Westinghouse Air Brake Technologies Corporation and Masco Corporation's Expenses
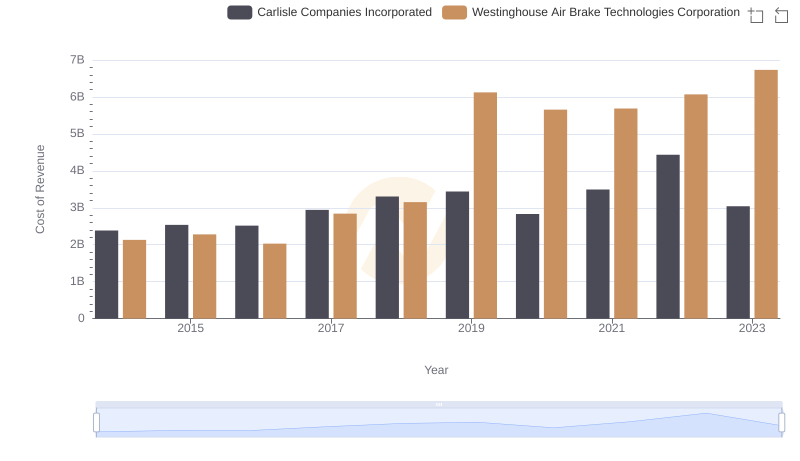
Cost of Revenue Trends: Westinghouse Air Brake Technologies Corporation vs Carlisle Companies Incorporated
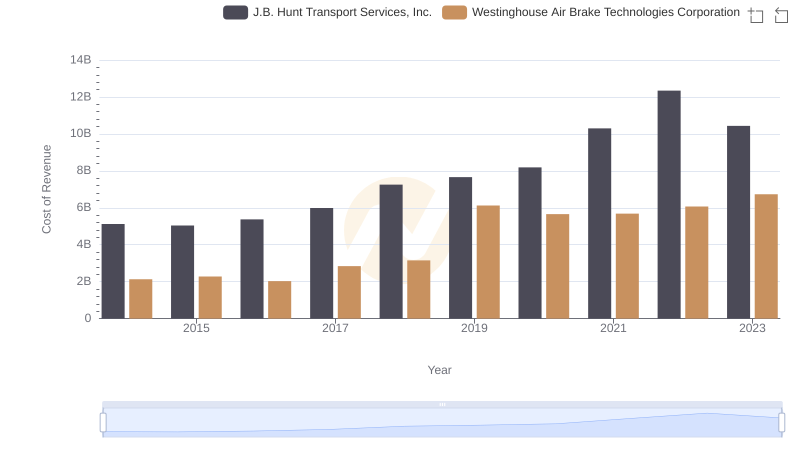
Comparing Cost of Revenue Efficiency: Westinghouse Air Brake Technologies Corporation vs J.B. Hunt Transport Services, Inc.
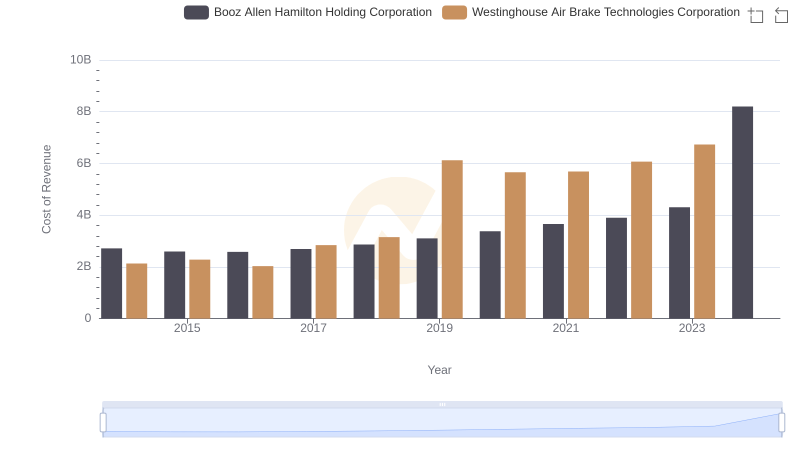
Westinghouse Air Brake Technologies Corporation vs Booz Allen Hamilton Holding Corporation: Efficiency in Cost of Revenue Explored
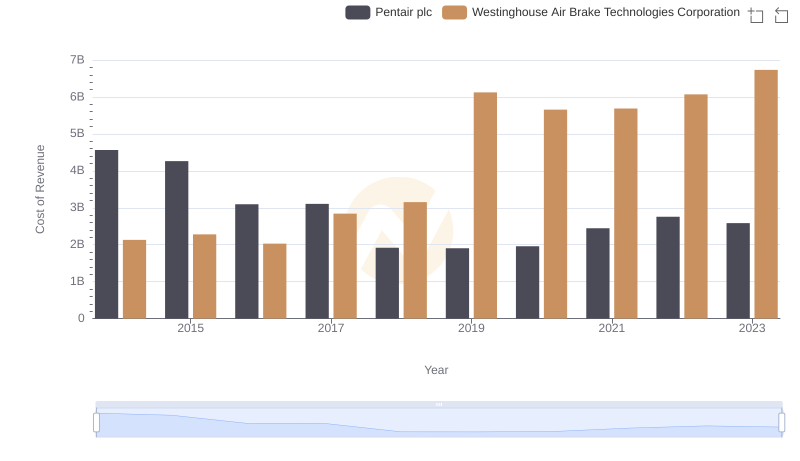
Analyzing Cost of Revenue: Westinghouse Air Brake Technologies Corporation and Pentair plc
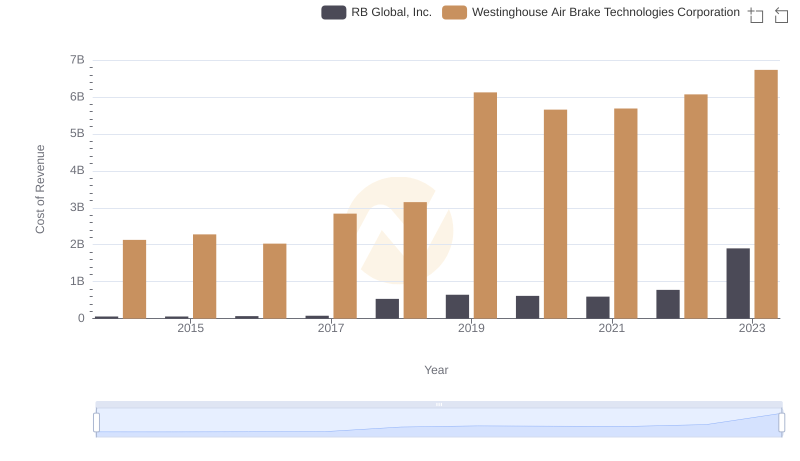
Comparing Cost of Revenue Efficiency: Westinghouse Air Brake Technologies Corporation vs RB Global, Inc.
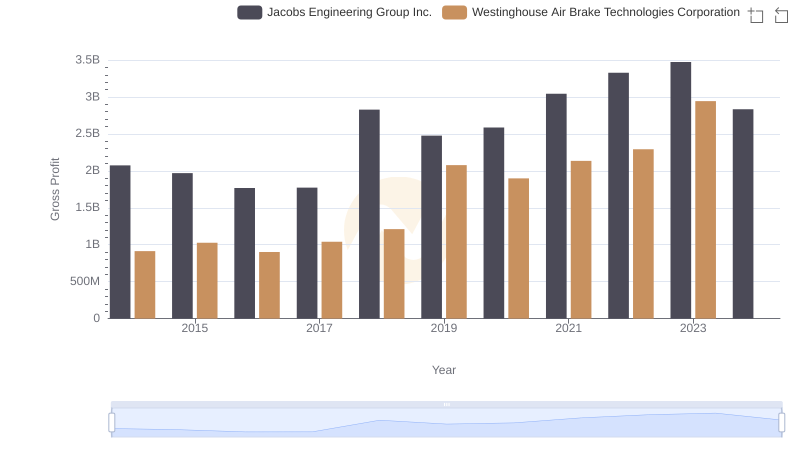
Key Insights on Gross Profit: Westinghouse Air Brake Technologies Corporation vs Jacobs Engineering Group Inc.
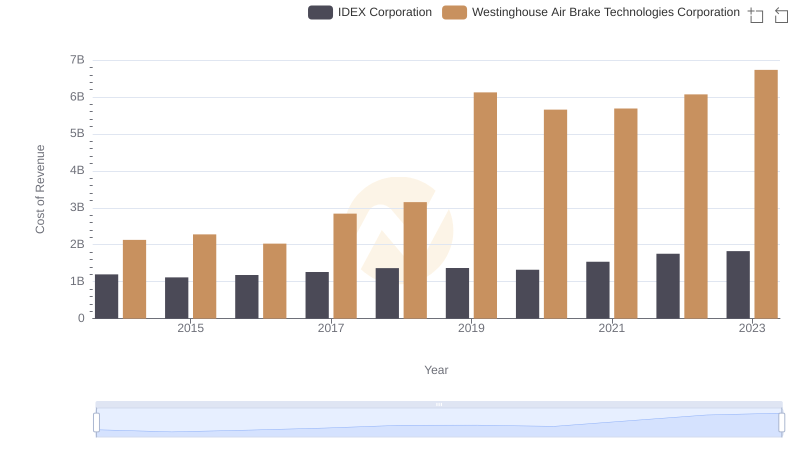
Comparing Cost of Revenue Efficiency: Westinghouse Air Brake Technologies Corporation vs IDEX Corporation
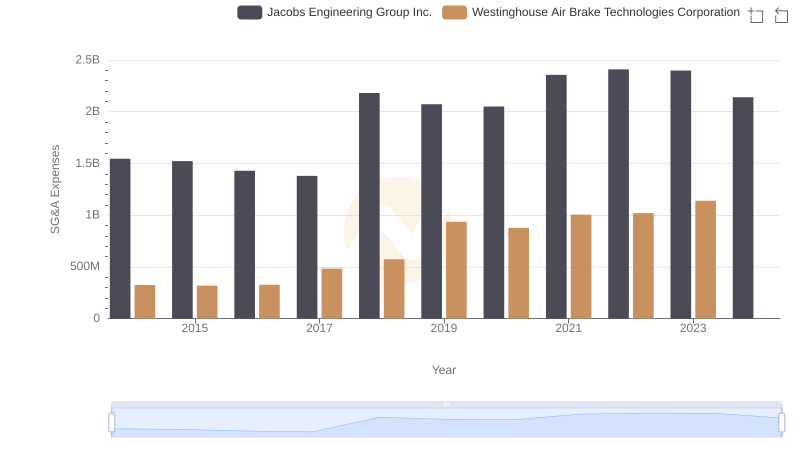
Comparing SG&A Expenses: Westinghouse Air Brake Technologies Corporation vs Jacobs Engineering Group Inc. Trends and Insights
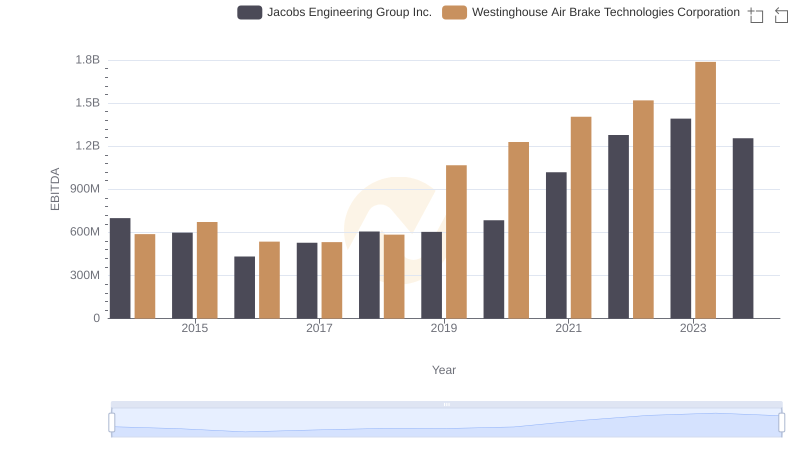
EBITDA Performance Review: Westinghouse Air Brake Technologies Corporation vs Jacobs Engineering Group Inc.