| __timestamp | Masco Corporation | Trane Technologies plc |
|---|---|---|
| Wednesday, January 1, 2014 | 8521000000 | 12891400000 |
| Thursday, January 1, 2015 | 7142000000 | 13300700000 |
| Friday, January 1, 2016 | 7357000000 | 13508900000 |
| Sunday, January 1, 2017 | 7644000000 | 14197600000 |
| Monday, January 1, 2018 | 8359000000 | 15668200000 |
| Tuesday, January 1, 2019 | 6707000000 | 16598900000 |
| Wednesday, January 1, 2020 | 7188000000 | 12454700000 |
| Friday, January 1, 2021 | 8375000000 | 14136400000 |
| Saturday, January 1, 2022 | 8680000000 | 15991700000 |
| Sunday, January 1, 2023 | 7967000000 | 17677600000 |
| Monday, January 1, 2024 | 7828000000 | 19838200000 |
Cracking the code
In the competitive landscape of industrial giants, Trane Technologies plc and Masco Corporation have been vying for dominance over the past decade. From 2014 to 2023, Trane Technologies consistently outperformed Masco Corporation, showcasing a robust growth trajectory. In 2023, Trane Technologies' revenue surged to approximately 17.7 billion, marking a 37% increase from its 2014 figures. Meanwhile, Masco Corporation experienced a more modest growth, peaking at around 8.7 billion in 2022, before slightly declining in 2023.
The data reveals a compelling narrative of resilience and strategic growth. Trane Technologies' revenue grew by an impressive 37% over the decade, while Masco Corporation's revenue fluctuated, reflecting the challenges and opportunities in the market. This revenue showdown highlights the dynamic nature of the industrial sector, where innovation and strategic foresight are key to maintaining a competitive edge.
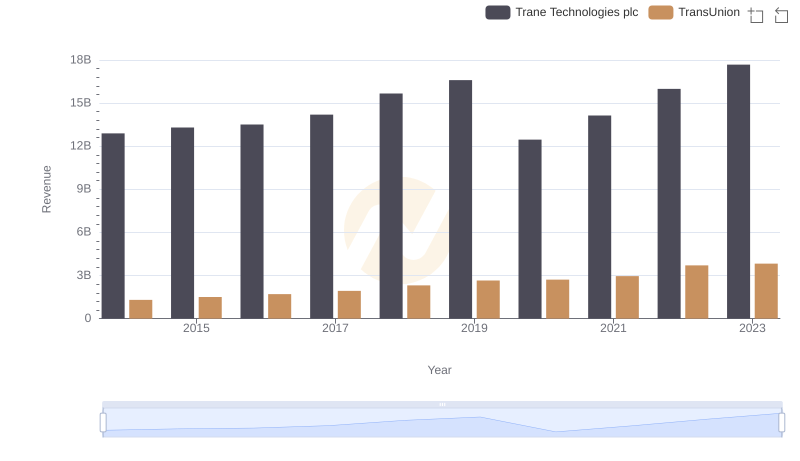
Revenue Insights: Trane Technologies plc and TransUnion Performance Compared
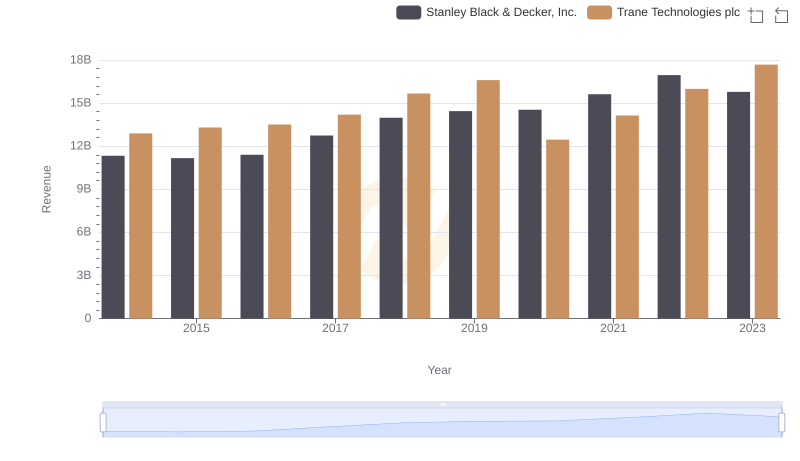
Trane Technologies plc or Stanley Black & Decker, Inc.: Who Leads in Yearly Revenue?
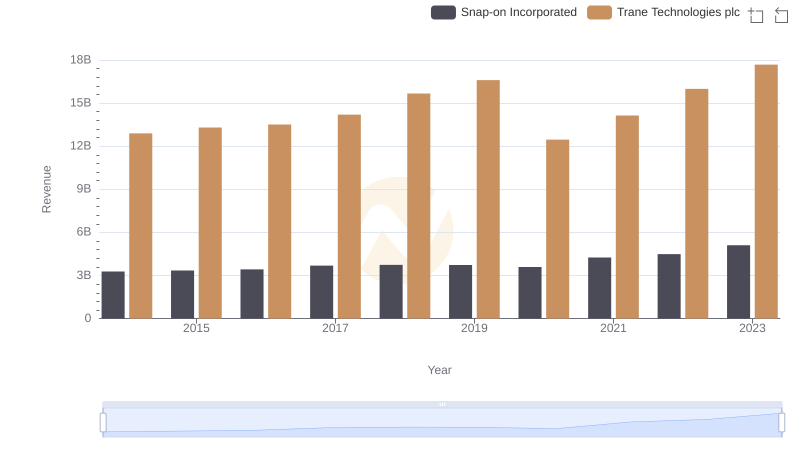
Annual Revenue Comparison: Trane Technologies plc vs Snap-on Incorporated
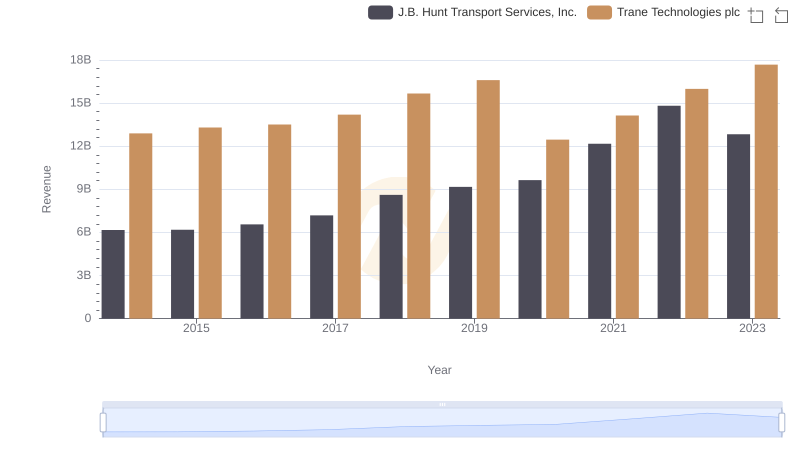
Trane Technologies plc vs J.B. Hunt Transport Services, Inc.: Examining Key Revenue Metrics
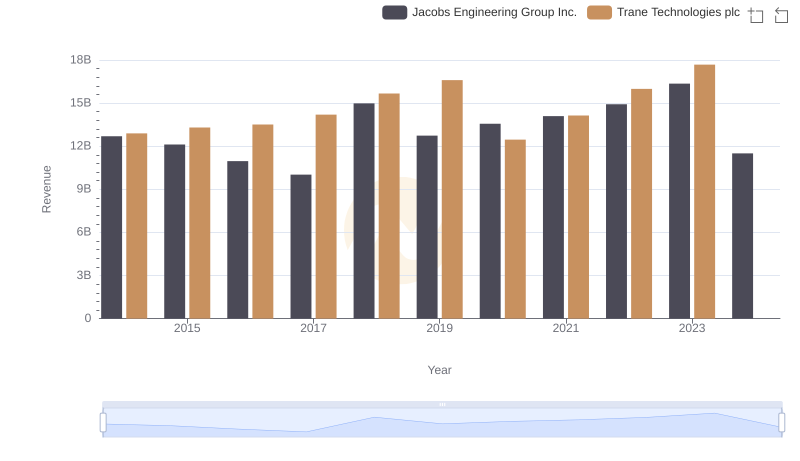
Annual Revenue Comparison: Trane Technologies plc vs Jacobs Engineering Group Inc.
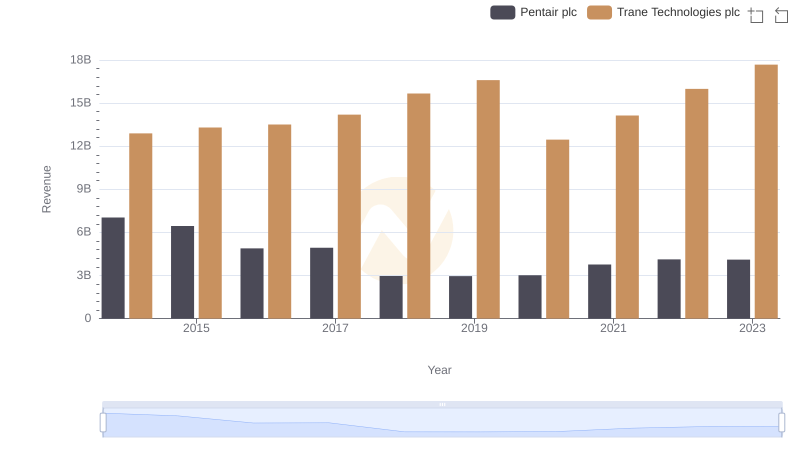
Trane Technologies plc vs Pentair plc: Examining Key Revenue Metrics
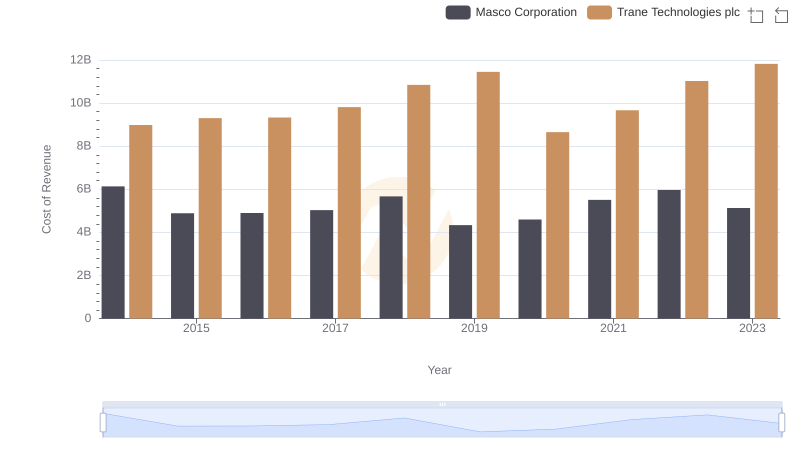
Cost of Revenue Trends: Trane Technologies plc vs Masco Corporation
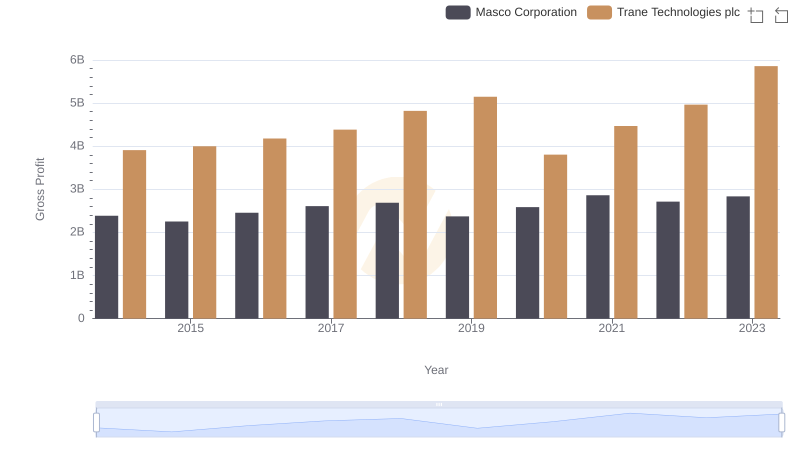
Trane Technologies plc vs Masco Corporation: A Gross Profit Performance Breakdown
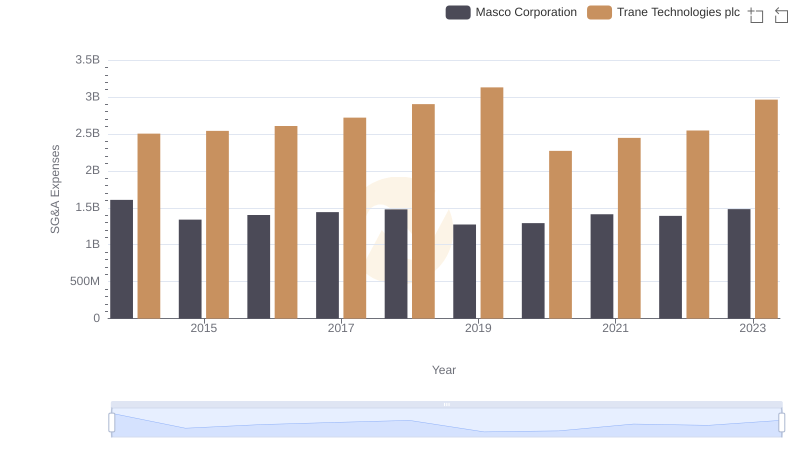
Operational Costs Compared: SG&A Analysis of Trane Technologies plc and Masco Corporation