| __timestamp | Carlisle Companies Incorporated | Rockwell Automation, Inc. |
|---|---|---|
| Wednesday, January 1, 2014 | 512300000 | 1346000000 |
| Thursday, January 1, 2015 | 631900000 | 1359100000 |
| Friday, January 1, 2016 | 580200000 | 1200700000 |
| Sunday, January 1, 2017 | 609300000 | 1258400000 |
| Monday, January 1, 2018 | 696100000 | 1568400000 |
| Tuesday, January 1, 2019 | 851000000 | 1150200000 |
| Wednesday, January 1, 2020 | 733100000 | 1410200000 |
| Friday, January 1, 2021 | 816100000 | 1808300000 |
| Saturday, January 1, 2022 | 1483400000 | 1432100000 |
| Sunday, January 1, 2023 | 1210700000 | 1990700000 |
| Monday, January 1, 2024 | 1356800000 | 1567500000 |
In pursuit of knowledge
In the ever-evolving landscape of industrial automation and manufacturing, understanding financial health is crucial. Rockwell Automation, Inc. and Carlisle Companies Incorporated, two giants in their respective fields, have shown intriguing trends in their EBITDA over the past decade. From 2014 to 2023, Rockwell Automation consistently outperformed Carlisle, with an average EBITDA nearly 80% higher. Notably, Rockwell's EBITDA peaked in 2023, reaching almost double its 2014 value, showcasing robust growth and resilience.
Carlisle, while trailing, demonstrated significant growth, particularly in 2022, where its EBITDA surged by over 80% compared to 2014. However, 2023 saw a slight dip, indicating potential challenges or strategic shifts. Missing data for 2024 suggests a need for cautious optimism. This analysis underscores the dynamic nature of these industries and the importance of strategic financial management.
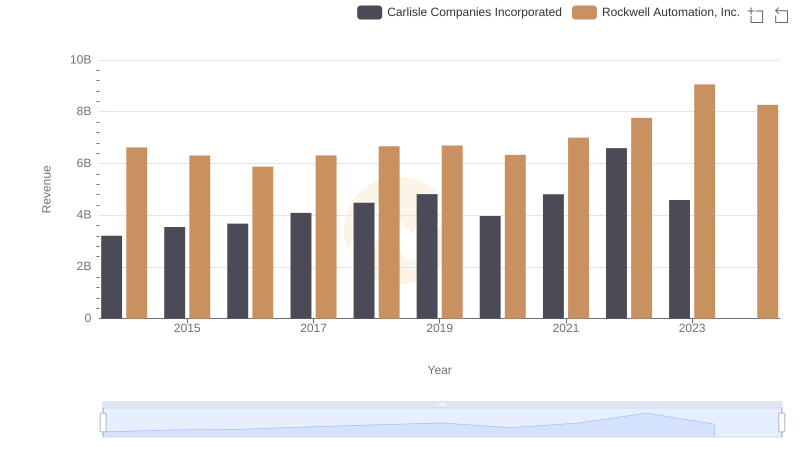
Rockwell Automation, Inc. vs Carlisle Companies Incorporated: Examining Key Revenue Metrics
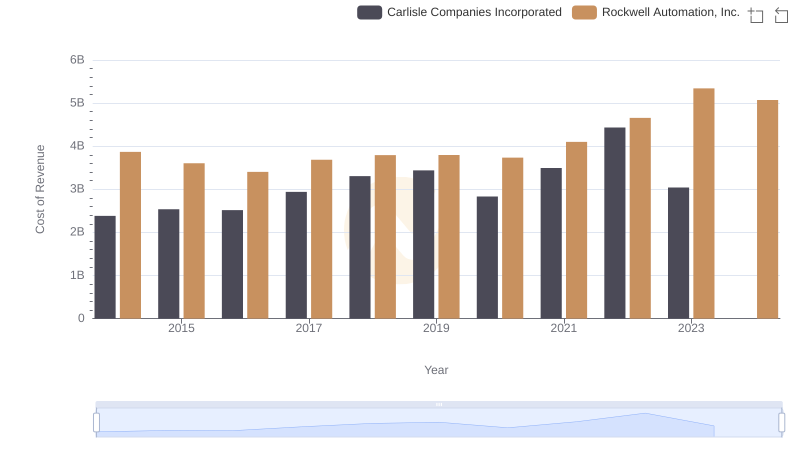
Cost of Revenue Trends: Rockwell Automation, Inc. vs Carlisle Companies Incorporated
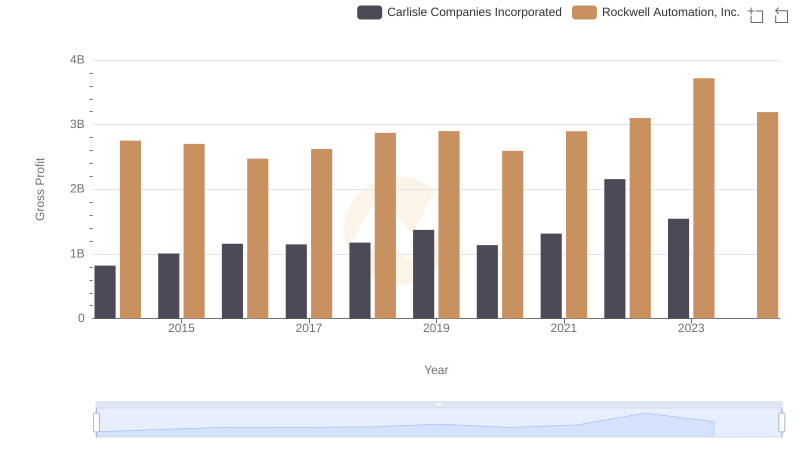
Gross Profit Analysis: Comparing Rockwell Automation, Inc. and Carlisle Companies Incorporated
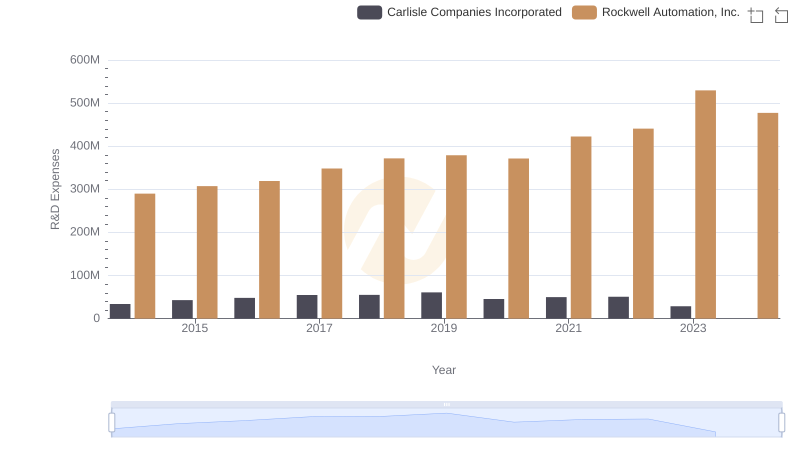
Rockwell Automation, Inc. or Carlisle Companies Incorporated: Who Invests More in Innovation?
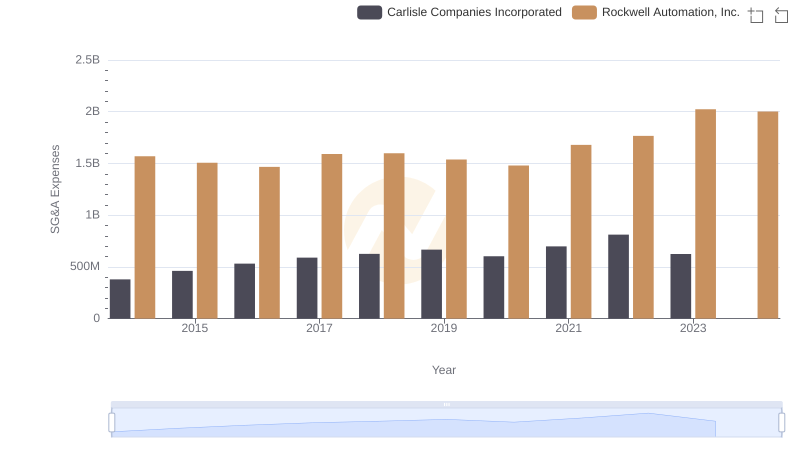
SG&A Efficiency Analysis: Comparing Rockwell Automation, Inc. and Carlisle Companies Incorporated
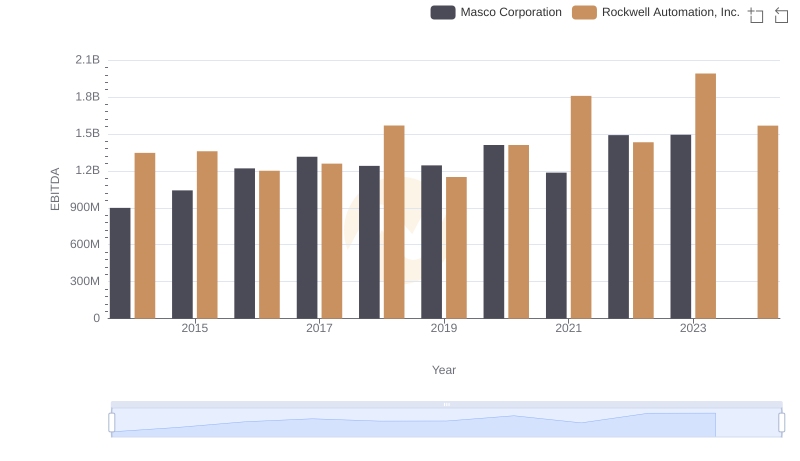
Professional EBITDA Benchmarking: Rockwell Automation, Inc. vs Masco Corporation
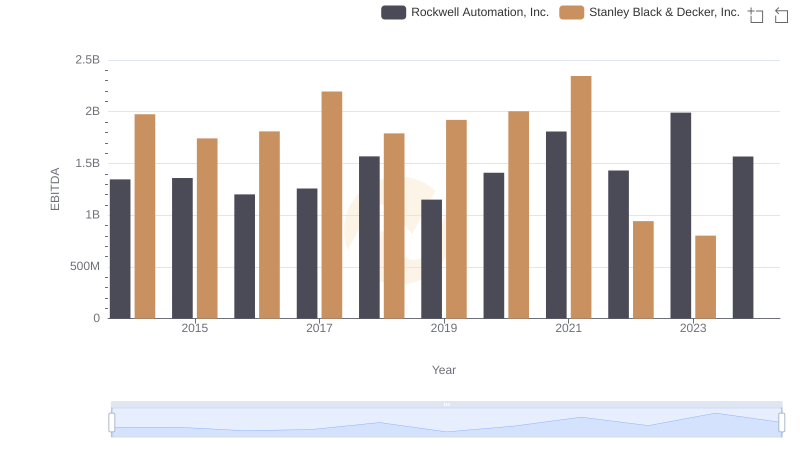
Rockwell Automation, Inc. and Stanley Black & Decker, Inc.: A Detailed Examination of EBITDA Performance
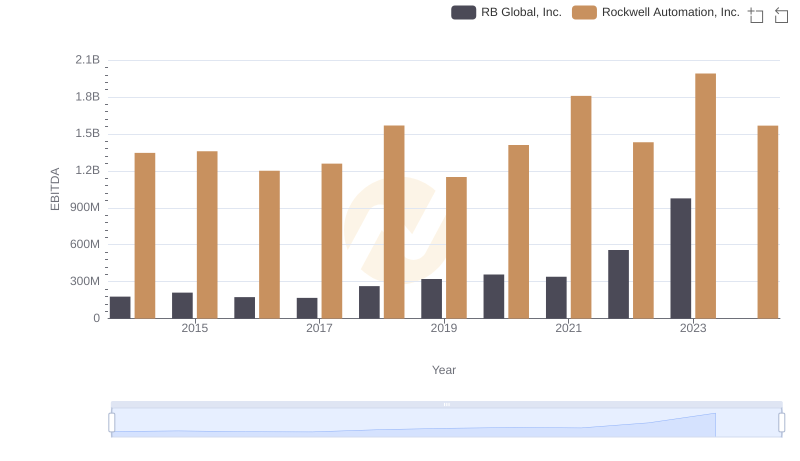
Rockwell Automation, Inc. and RB Global, Inc.: A Detailed Examination of EBITDA Performance
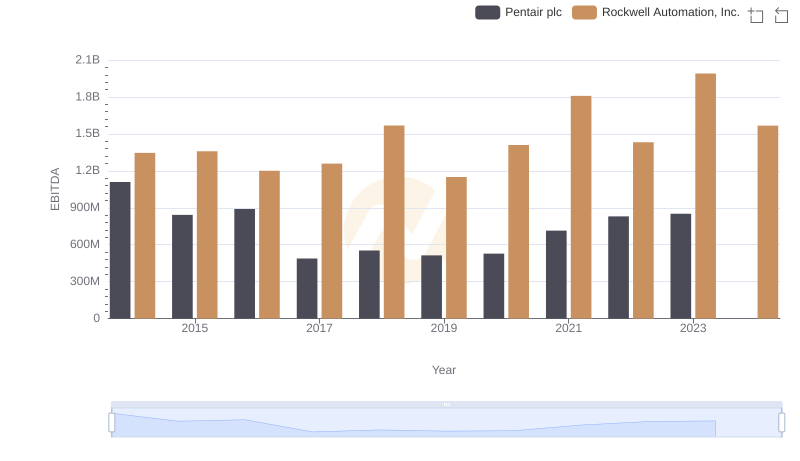
Comprehensive EBITDA Comparison: Rockwell Automation, Inc. vs Pentair plc
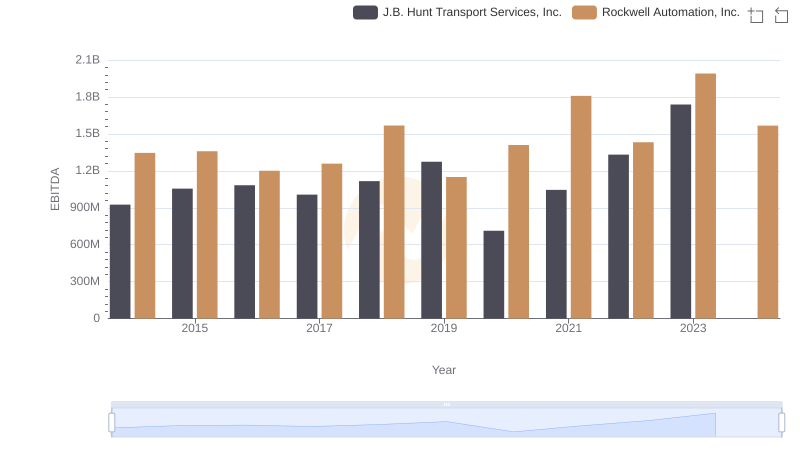
Rockwell Automation, Inc. and J.B. Hunt Transport Services, Inc.: A Detailed Examination of EBITDA Performance
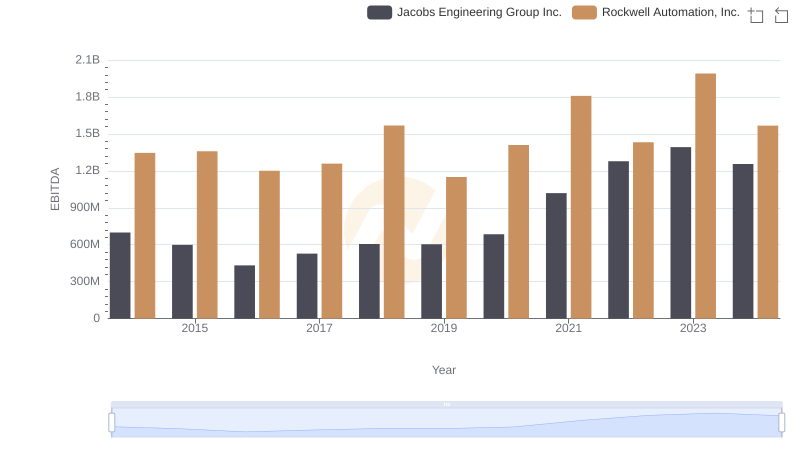
Rockwell Automation, Inc. vs Jacobs Engineering Group Inc.: In-Depth EBITDA Performance Comparison